1. Getting Started with vuSmartMaps™
3. Console
5. Configuration
6. Data Management
9. Monitoring and Managing vuSmartMaps™
![]()
Welcome to the O11ySources User Guide! This guide is your essential resource for mastering Observability Sources (referred to as O11ySources hereafter) within the vuSmartMapsplatform. With O11ySources, you can effortlessly set up data sources, storyboards, and alert rules, streamlining your data pipeline and ETL process.
![]()
![]()
Ensure vuSmartMaps is installed before configuring O11ySources and that you have admin access to configure O11ySources.
![]()
![]()
In today’s tech-driven world, O11ySources serves as your gateway to understanding your system’s performance, providing actionable insights into various critical aspects. O11ySources allows you to monitor a wide array of essential data sources, such as databases, network devices, applications, web servers, and more.
![]()
By collecting and analyzing data from these sources, O11ySources empowers you to optimize the performance of your systems. For example, it helps you track the response times of your applications, ensuring they run smoothly and efficiently. It also enables you to monitor server resource utilization, identifying potential bottlenecks that may impact your system’s responsiveness.
![]()
Whether you’re evaluating the health of your servers, tracking network performance, analyzing application behavior, or diving into the performance of your database queries, O11ySources provides you with the specific tools and insights needed to ensure the efficiency and effectiveness of the systems.
![]()
![]()
O11ySources, such as ‘Linux Monitor’ and ‘Apache’, seamlessly integrate with your existing setup. They consolidate data from multiple sources, creating a unified data flow that empowers your analysis and reporting systems. This integration streamlines data onboarding from target systems to enhance business observability with vuSmartMaps.
![]()
![]()
Explore how data flows within the system by examining the three key stages of the data journey:
![]()

![]()
![]()
To fully utilize the O11ySource framework, your journey starts with configuring data sources by enabling O11ySources. This guide will be your trusted companion, guiding you through these essential steps. As you delve deeper, you’ll gain a profound understanding of the vital components that keep your data flowing smoothly within your system.
![]()
![]()
Accessing and managing O11ySources in vuSmartMaps is a simple process. Here’s how you can do it:
![]()
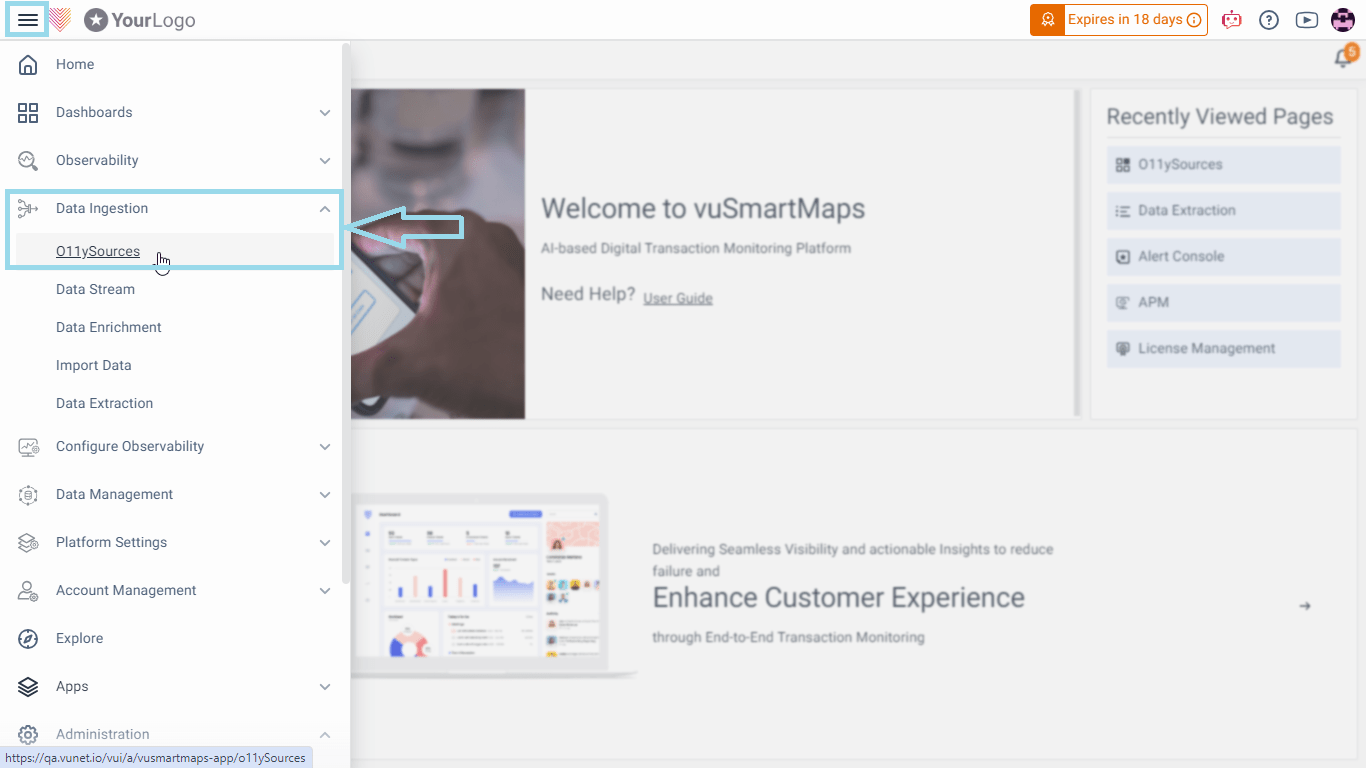
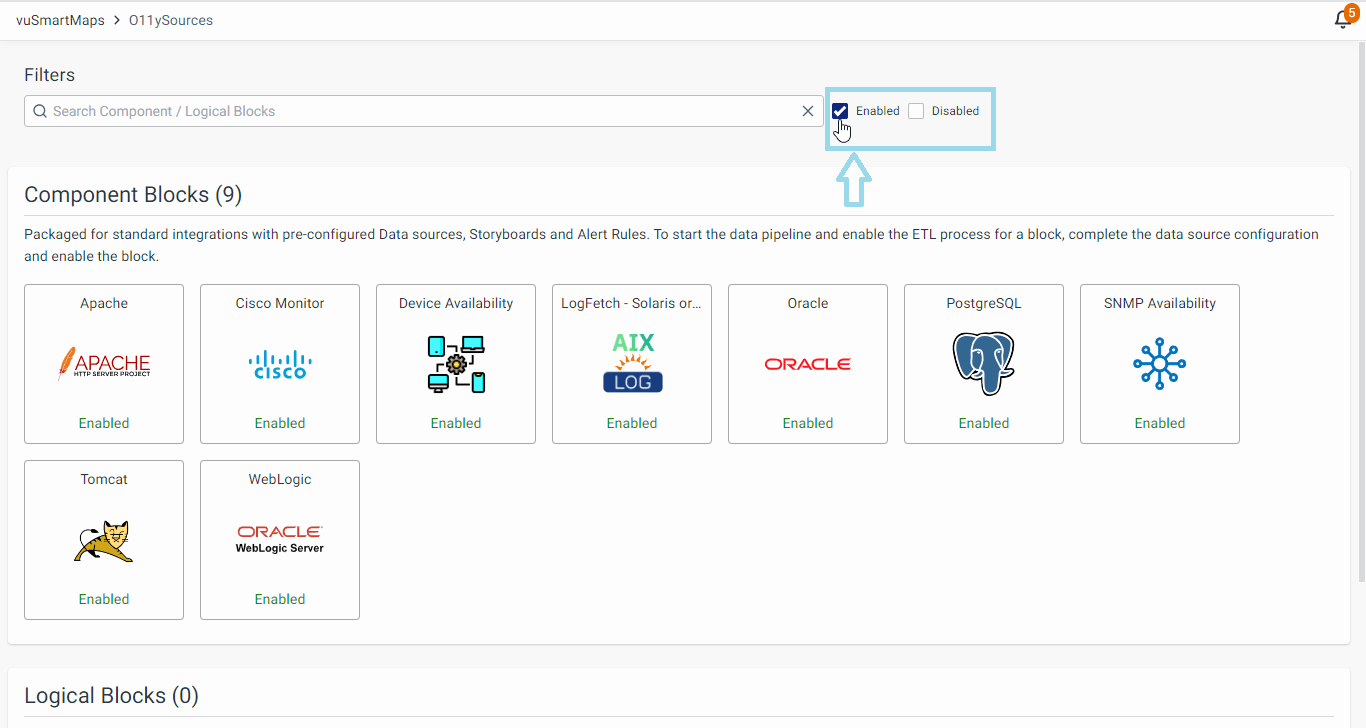
💡Note: When O11ySources is enabled, it shows the Alert Rules and Storyboards linked to the displayed sources. If it is disabled, it hides them. Ensure that you’ve followed all the instructions in the Get Started section to enable data onboarding for seamless operations.
![]()
![]()
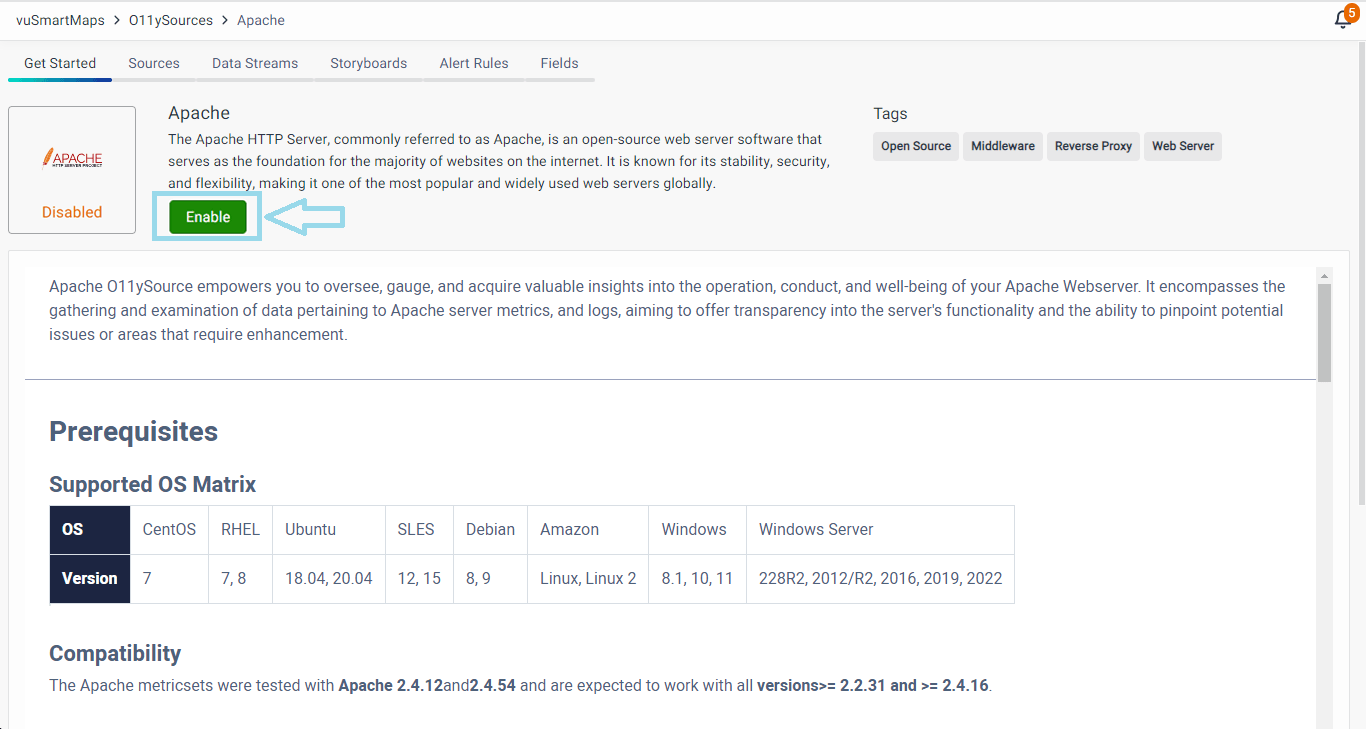
To understand the workflow more properly, as an example, we discuss the steps to configure the source for Linux Monitor in detail.
![]()
![]()
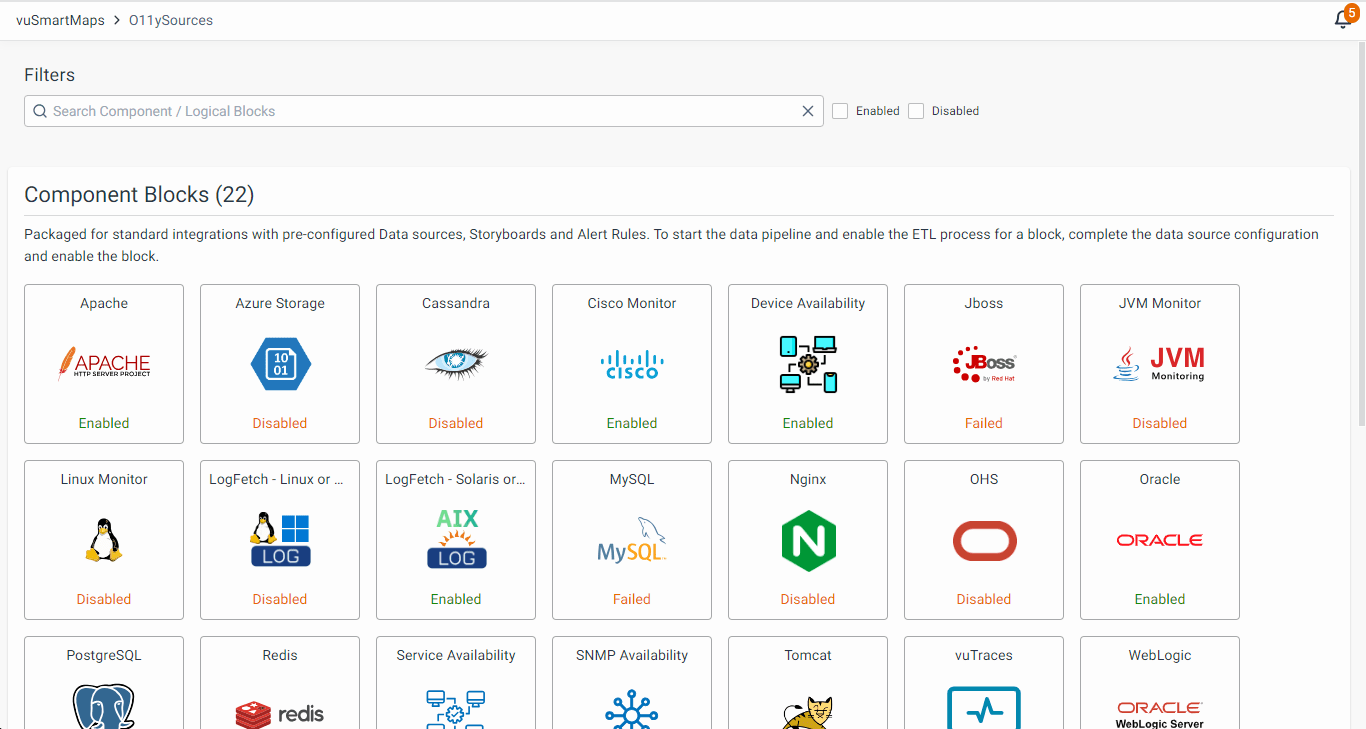
Each O11ySource comprises the following sections:
![]()
![]()
Each of these sections plays a crucial role in configuring and managing your O11ySource effectively. Follow along with this guide to harness the full potential of O11ySources and gain valuable observability into your systems.
![]()
![]()
![]()
Welcome to the O11ySources Diagnostics feature, a powerful addition to the O11ySources framework. This feature empowers you with the ability to seamlessly configure your O11ySources integration while effortlessly diagnosing potential data-related issues. By gaining insights into the data collection process, you’ll be equipped to enhance data visualization and decision-making.
![]()
As an end user with the privilege to configure sources for O11ySources integration, the O11ySources Diagnostics feature is designed to offer you an intuitive configuration process coupled with swift troubleshooting capabilities. This empowers you to not only set up your data sources seamlessly but also to swiftly identify and resolve any data-related challenges. Ultimately, this feature enhances your control over data and enriches your user experience.
![]()
The O11ySources Diagnostics feature serves the following purposes and brings corresponding benefits to users:
![]()
![]()
The O11ySources Diagnostics feature effortlessly handles multiple diagnostics instances, ensuring minimal interference with other O11ySources. Even when dealing with an extensive number of data sources (~1000) and multiple agents, this feature continues to function robustly.
![]()
![]()
O11ySources simplifies source configuration but can pose challenges when data doesn’t appear as expected on dashboards. This complexity arises from the intricate data flow journey involving data ingestion, processing, and storage. Users often struggle to diagnose issues due to this complexity.
![]()
O11ySources Diagnostics steps in to bridge this gap, helping users understand the journey and troubleshoot effectively. This feature offers insights into the intricate data flow, making it easier to identify and resolve data-related issues. It ensures smoother operations and reliable data visualization, enhancing overall system efficiency.
![]()
The detailed instructions on working with O11ySources Diagnostics are discussed separately.
![]()
![]()


