


Why Leading Ops Teams Choose vuApp360
Map Your Entire Architecture Instantly
vuApp360 automatically discovers and maps your entire application landscape using OpenTelemetry standards, without touching a single line of code. Transform weeks of manual documentation work into real-time, always-accurate service maps that update as your architecture evolves.

Connect Every Error to Business Impact
Every trace connects directly to business metrics—see which customer transactions are failing and their direct impact on SLAs and customer experience. Get automated root cause analysis with confidence scores, so you can prioritize fixes based on business outcomes—not just technical severity.
Prevent Issues Before Customers Feel Them
ML algorithms learn your application's unique patterns and detect anomalies humans miss. With intelligent alert correlation eliminate noise and get topology-aware root cause analysis. Shift from reactive firefighting to proactive issue prevention that scales with your transaction volumes.
Ship Code Faster With Complete Confidence
Give development teams complete visibility into application interactions and dependencies. Track request rates, error rates, and duration across every service while understanding the business impact of code changes before deployment. Deploy with confidence that won't break customer experience.
Unlock Actionable Insights for Fast, Reliable Applications
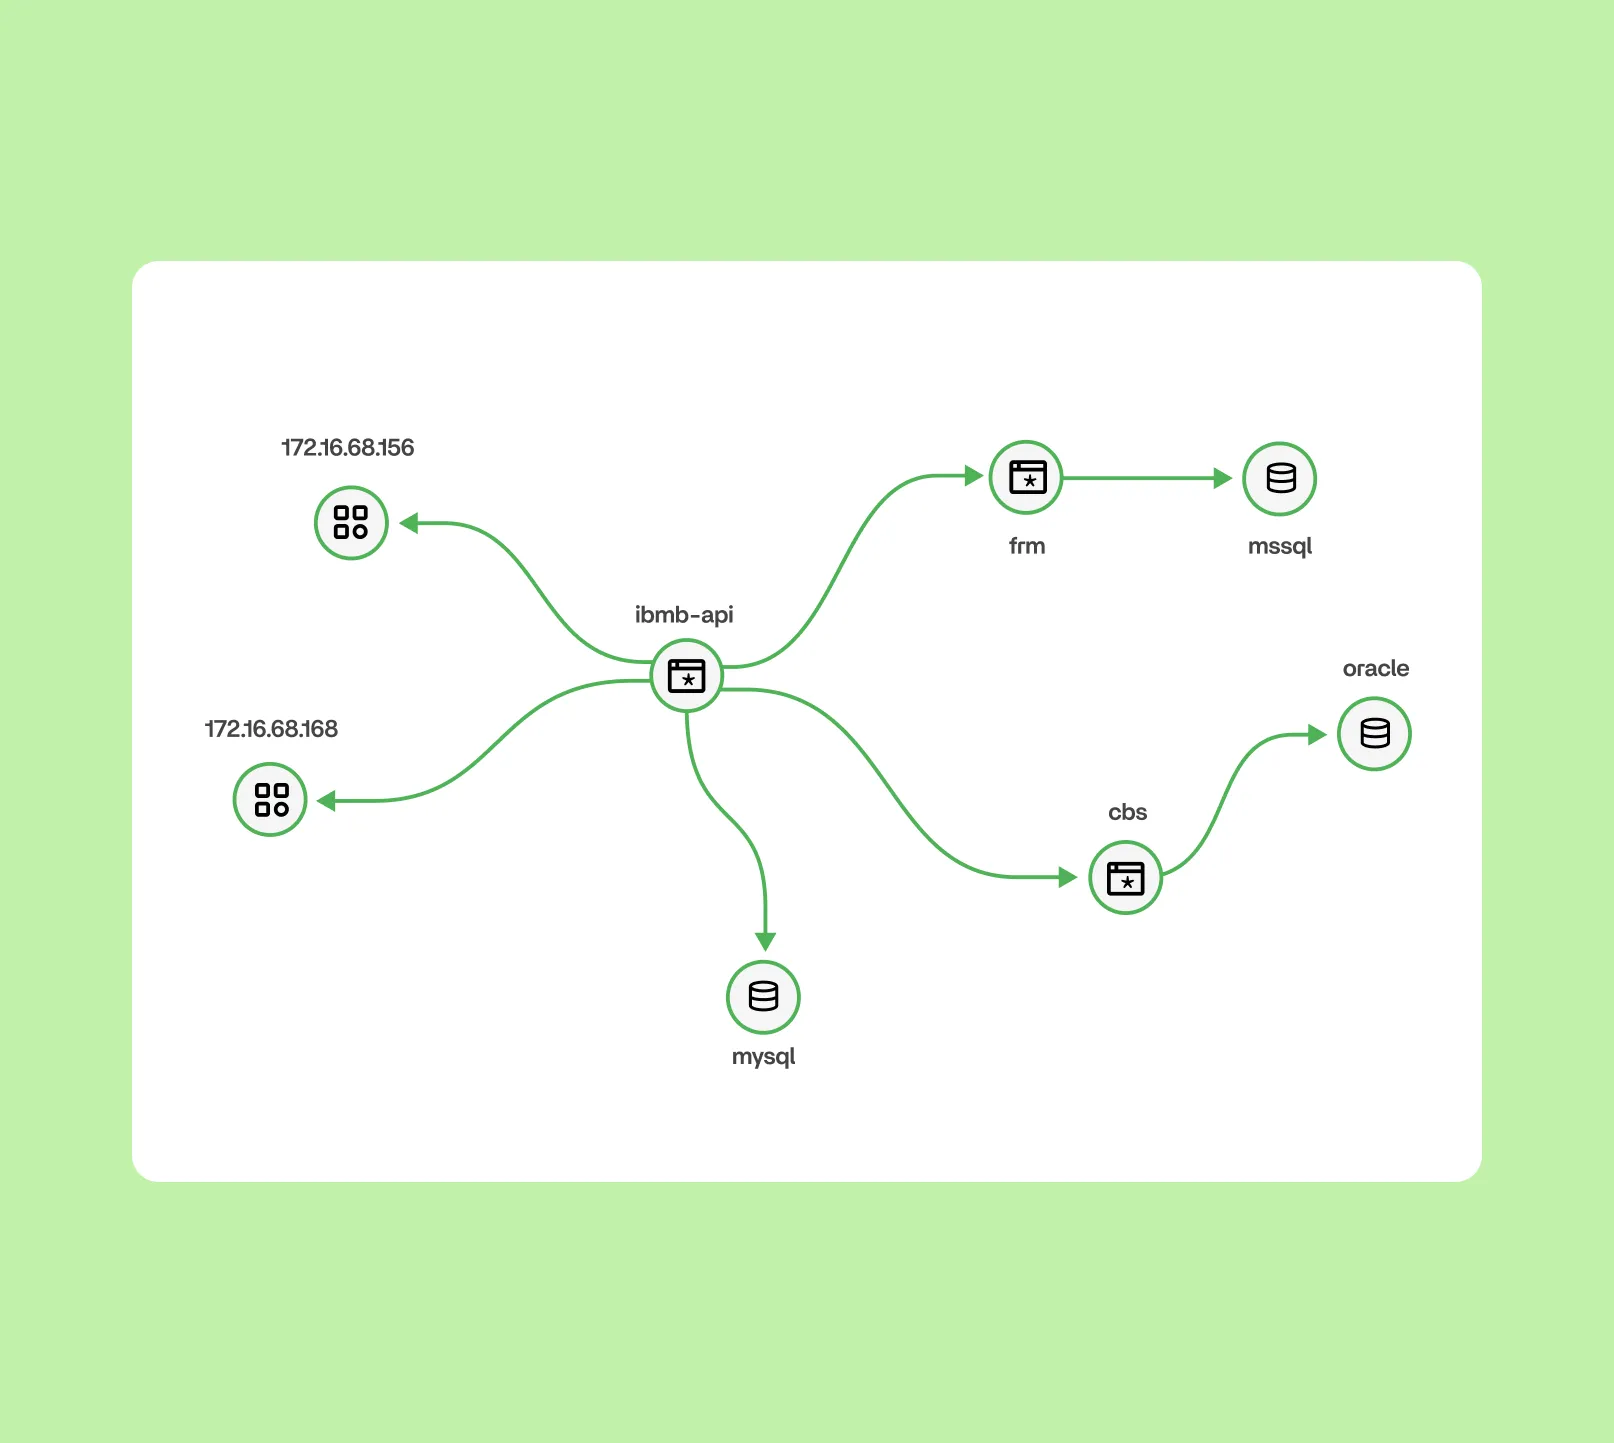
Service Map & Auto-Discovery
Instantly visualize every application dependency and service interaction, even across hybrid environments.
- Real-time mapping via OpenTelemetry: No code changes, auto-detection across microservices, APIs, and 3rd-party integrations.
- Interactive health snapshot per service: Hover to see service status, connections, and recent activity at a glance.
Impact: Prevent blind spots and cut incident investigation by half.
Service Catalog & Ownership
Radically simplify service ownership and change management in distributed teams.
- Service Catalog: Manage hundreds of services, assign ownership, track versions and dependencies.
- Find incident cause fast: Resolve interruptions with one-click service lookup and contextual root cause hints
Impact: Eliminate silos; reduce escalation loops during outages.
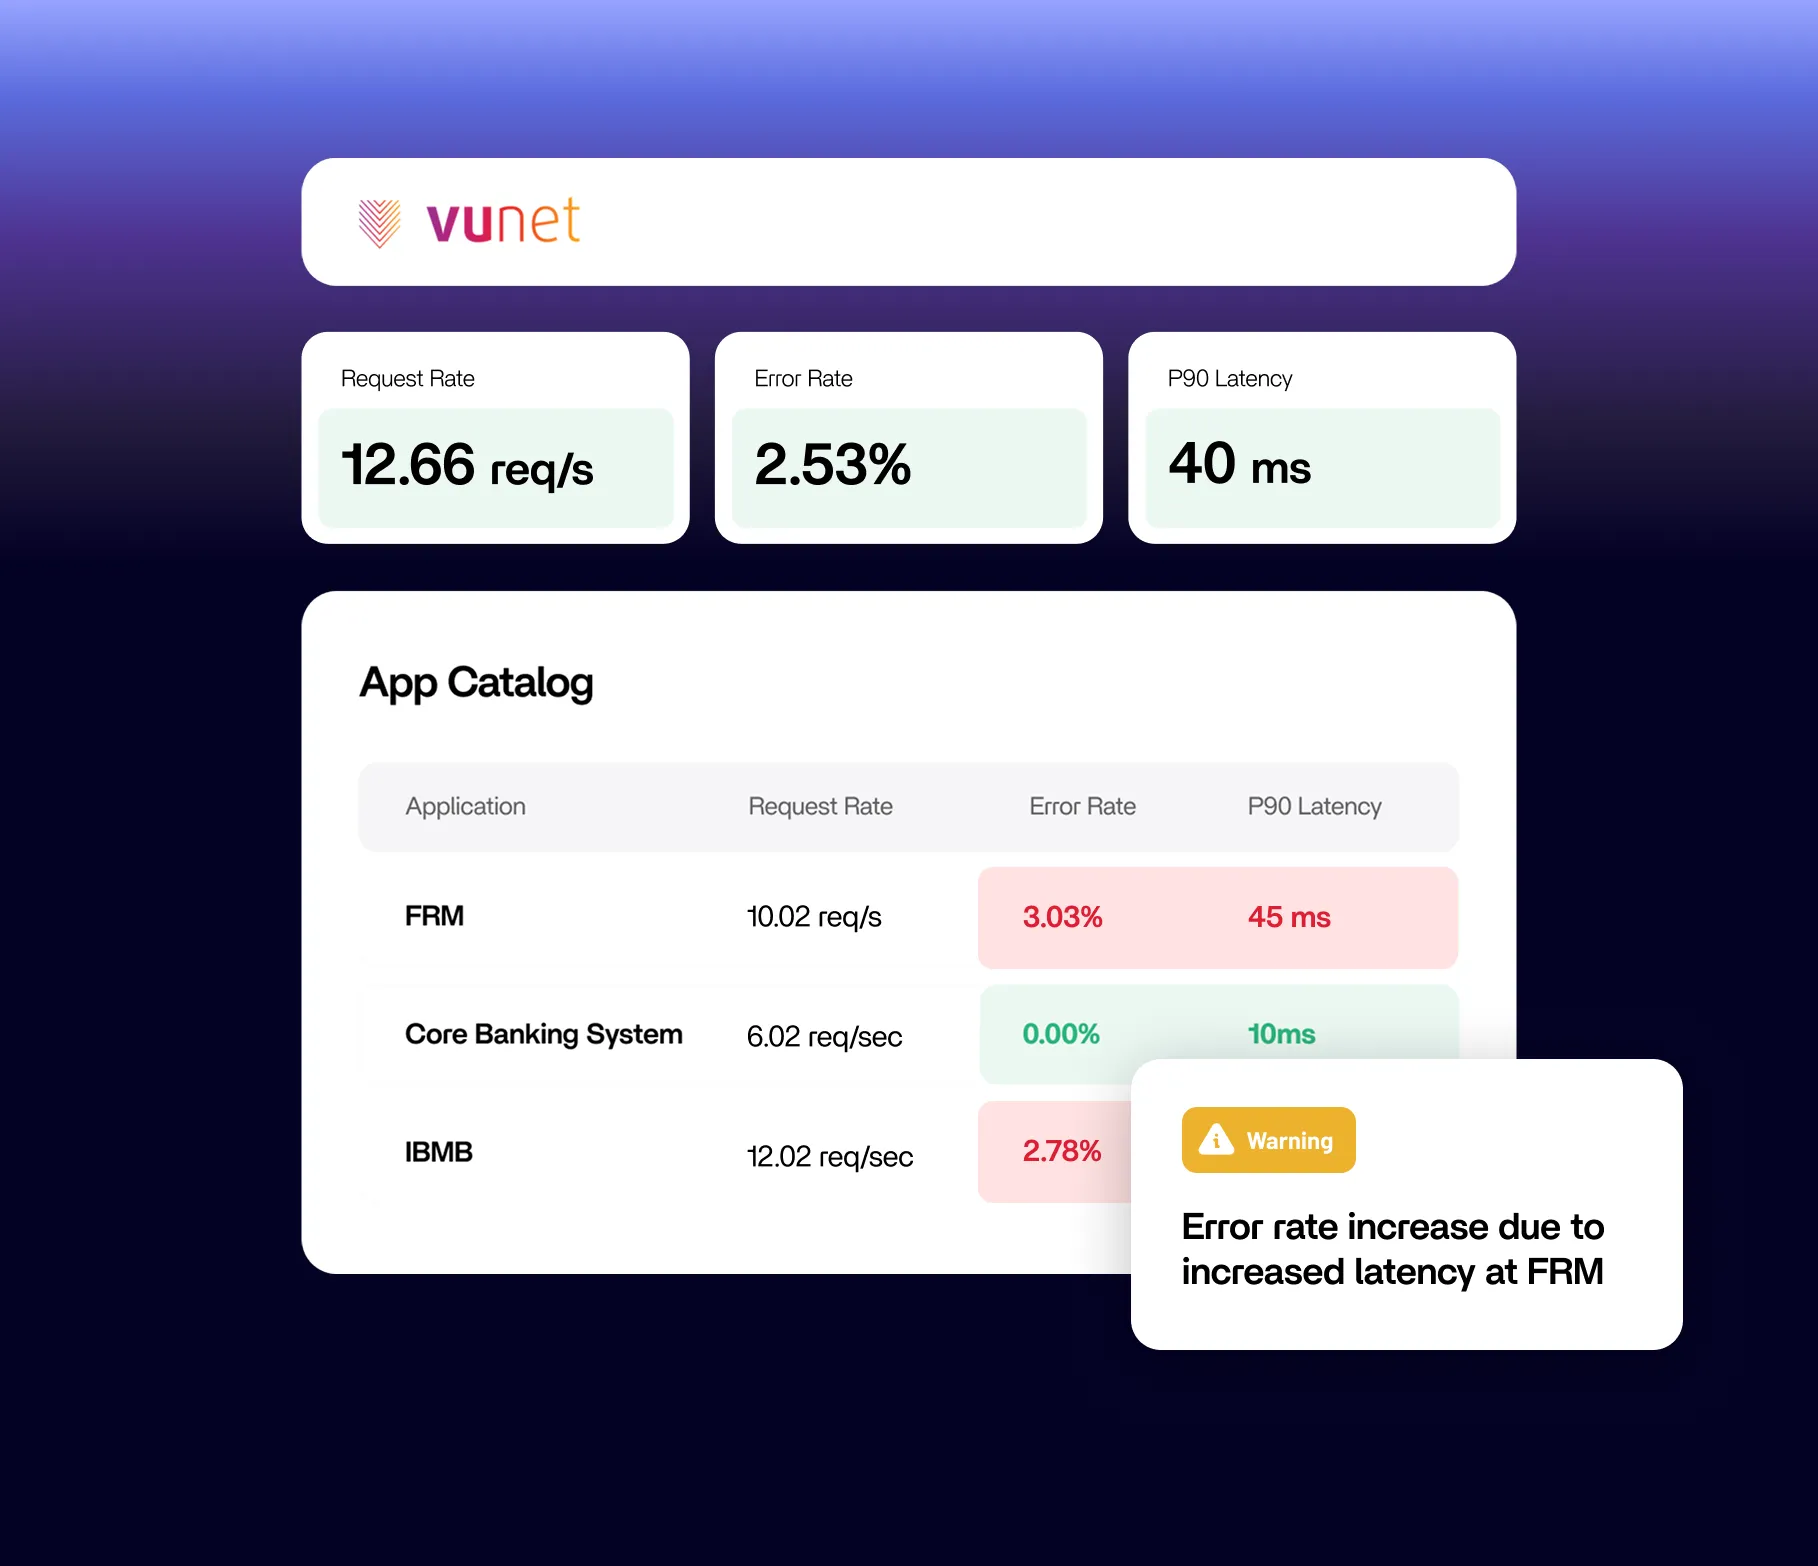
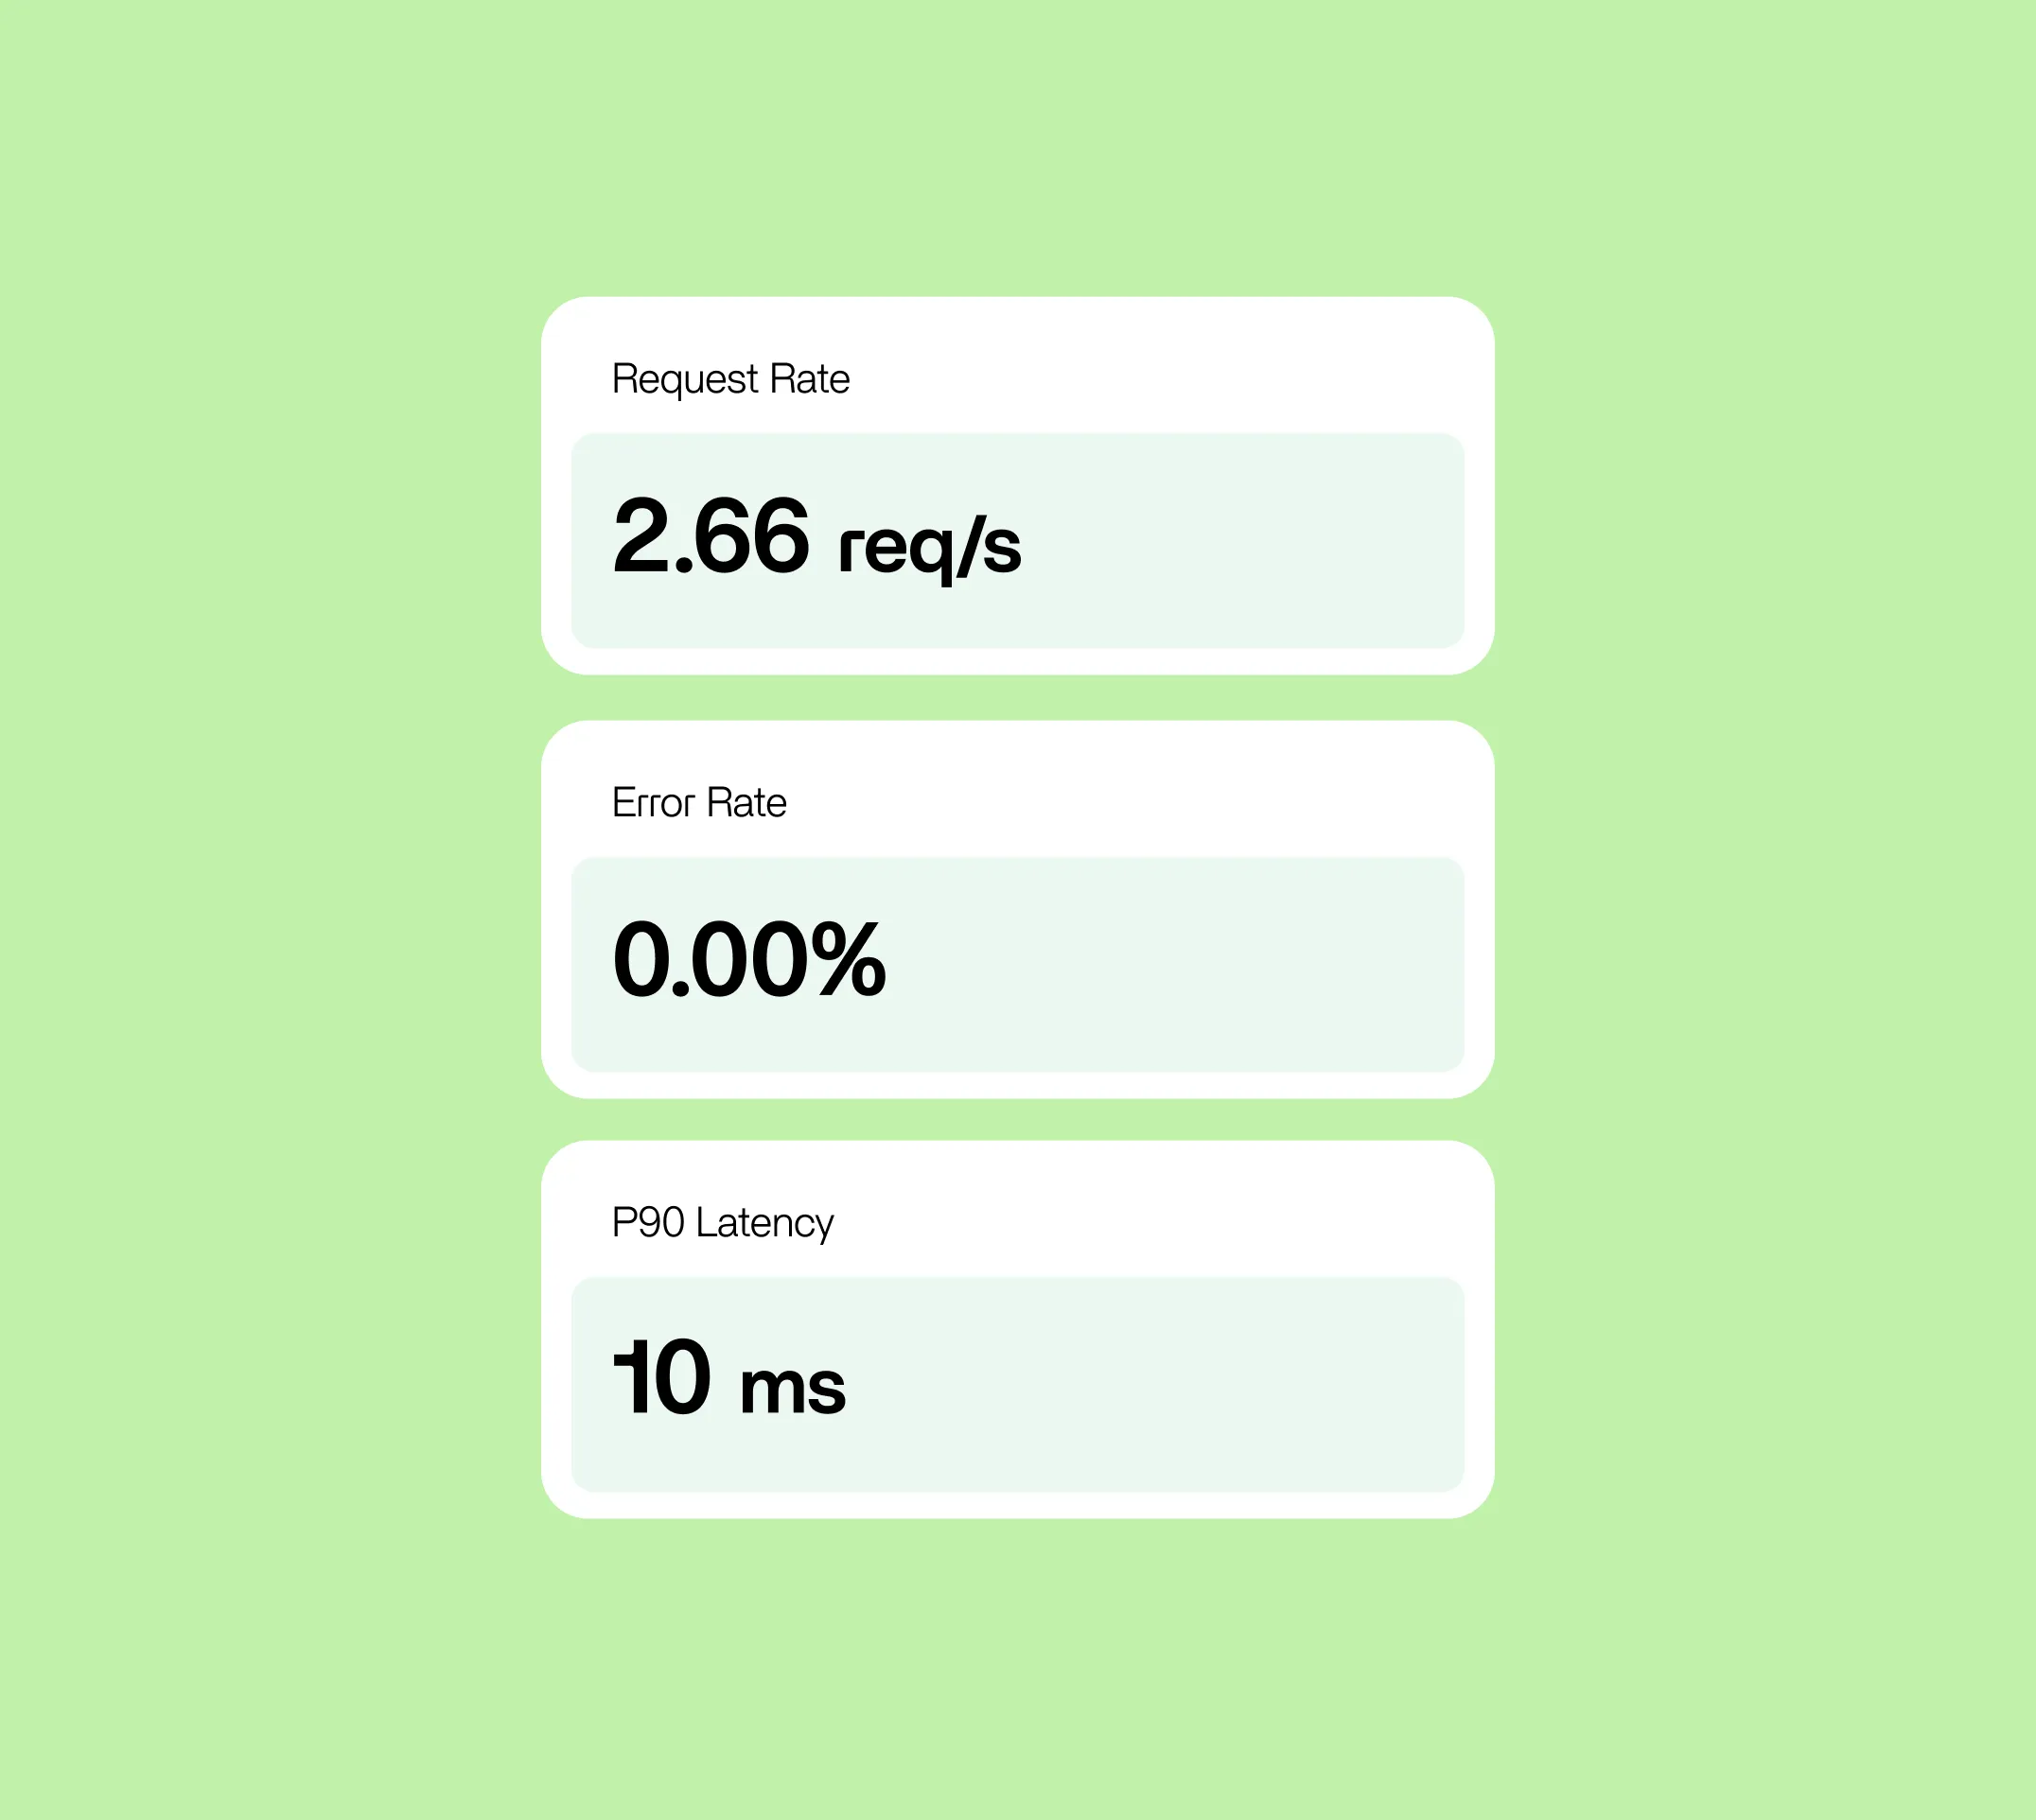
Key Application Metrics & RED Monitoring
Track the health that matters most for your apps—request rate, error rate, and duration—at any scale.
- RED metrics across every service and site: Immediate performance benchmarking, real-time alerts on thresholds.
- Drill-down analysis: Compare metrics across locations and versions to spot degradation anywhere in your stack.
Impact: Spot critical failures before they affect users, not after.
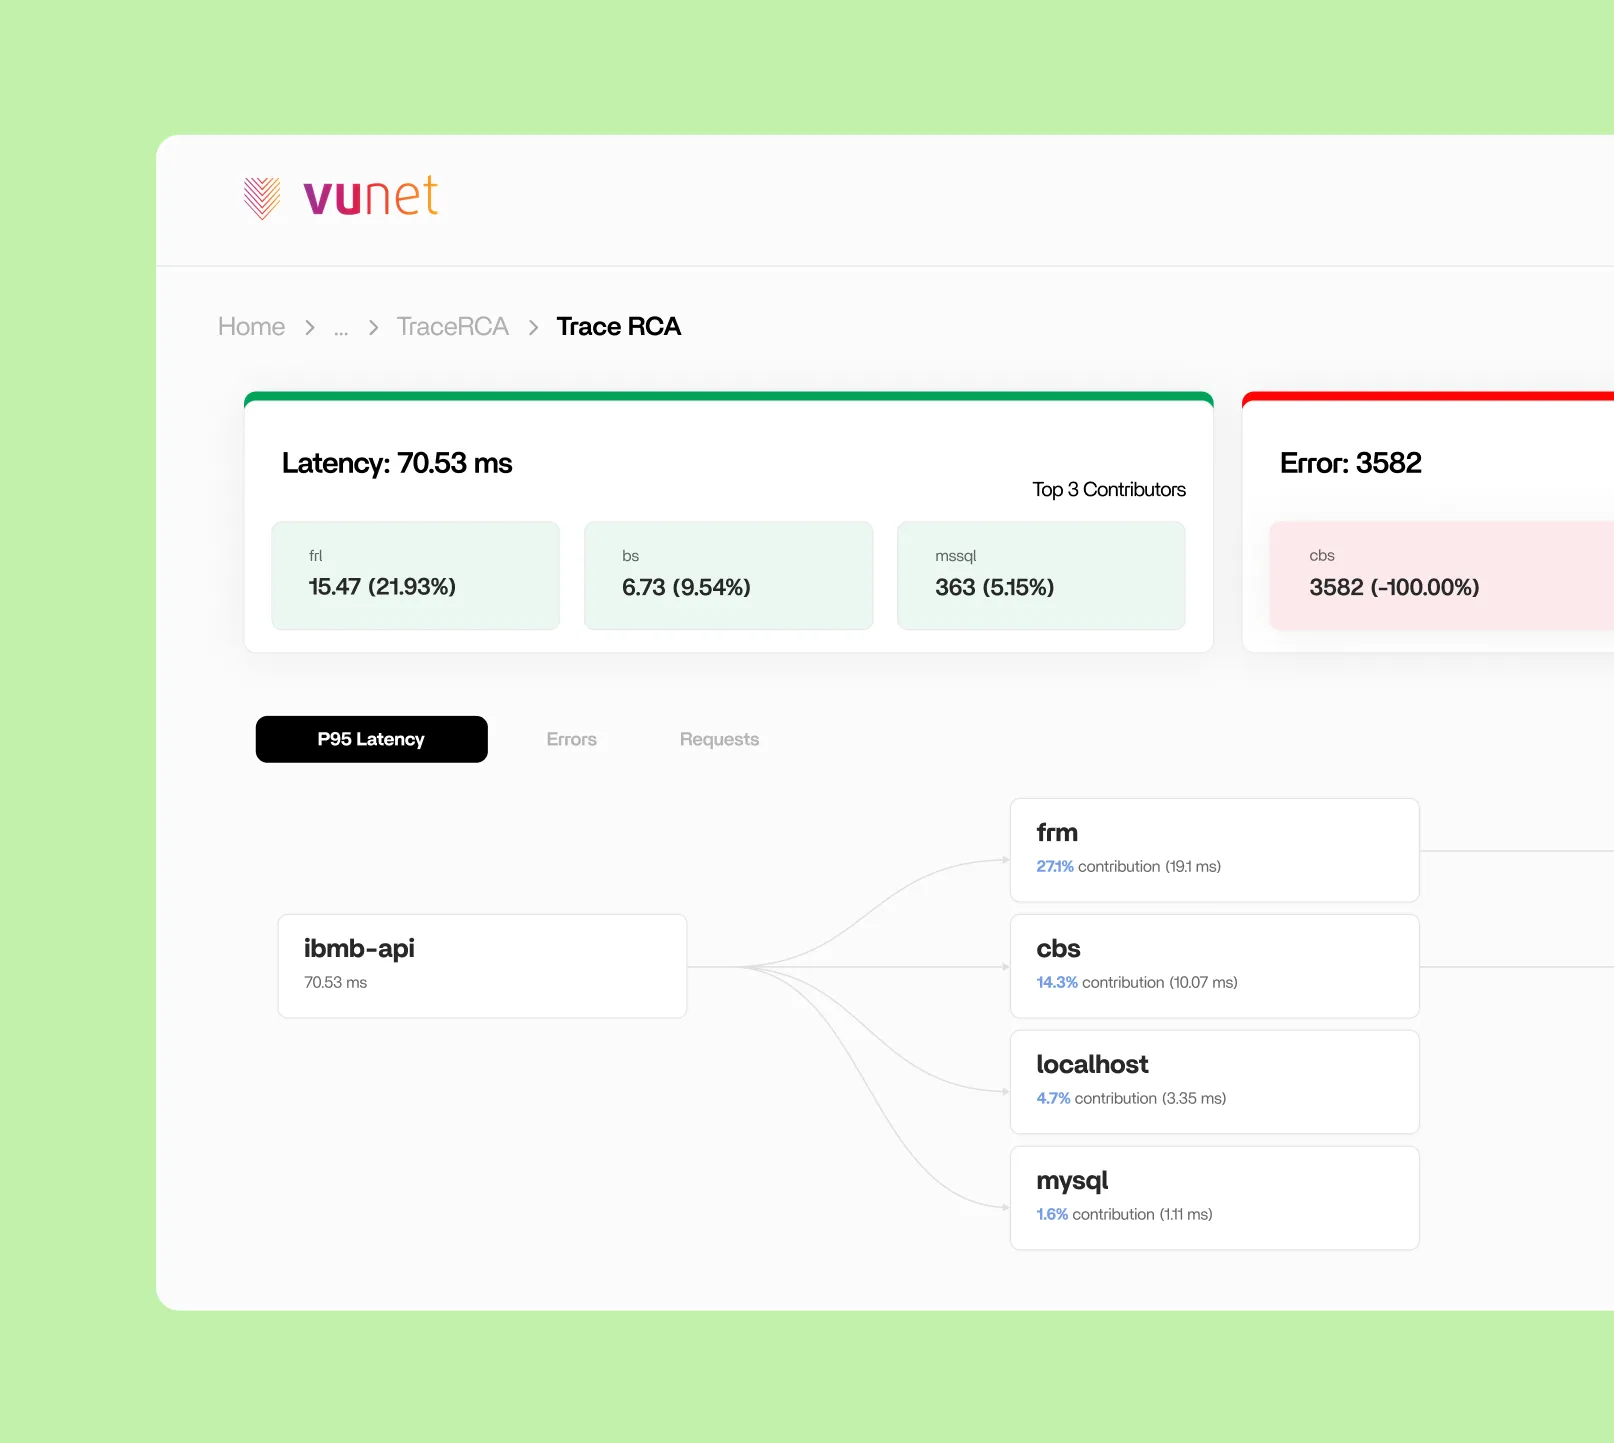
Distributed Tracing & Root Cause Analysis
Trace every transaction journey across microservices—identify bottlenecks with flame graphs, span metrics, and more.
- Traces Map: Visualize transaction flow step-by-step, pinpoint latency causes instantly.
- Automated root cause highlight: Get actionable suggestions—not just data—when incidents occur.
Impact: Reduce MTTR for complex customer-facing outages.
Proactive Alerts, Reports & Custom Dashboards
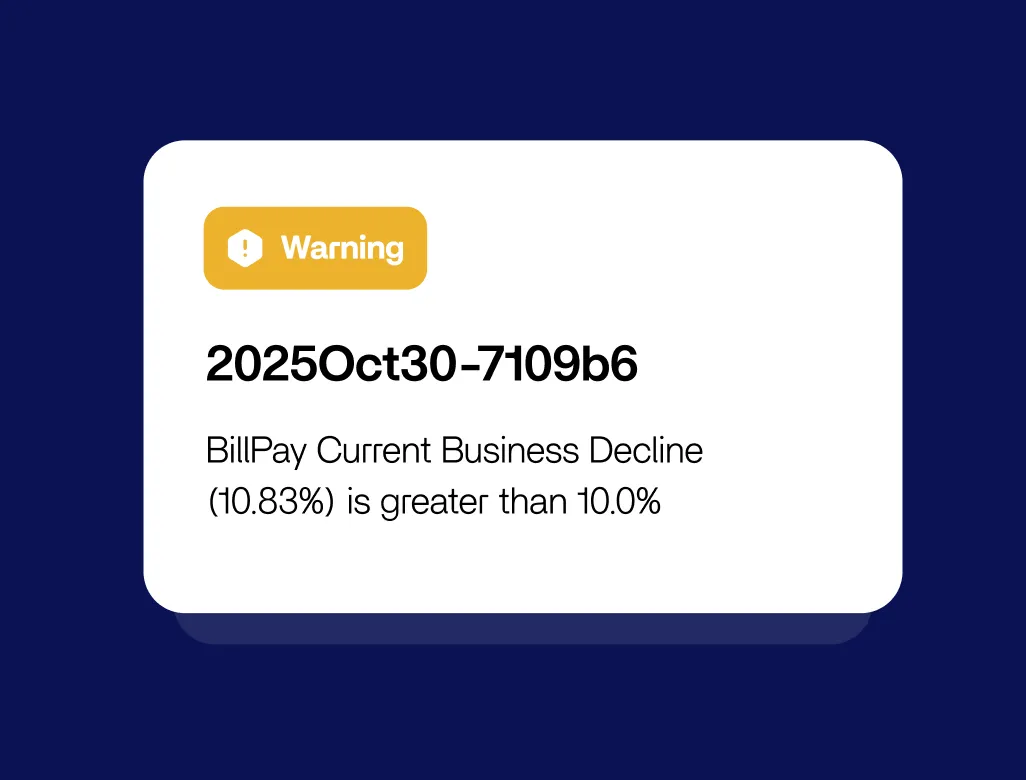
Critical alerts when it matters: duration, error rate, request drops, and anomalies are flagged instantly.
- Custom dashboards: Build views tailored to business-critical metrics, persona based views and operational flows.
- Weekly and ad-hoc reporting: Stay audit and compliance-ready with application quality reports.
Impact: Predict and prevent problems with zero manual monitoring.
Features That Turns Application Performance Into Actionable Insight
OpenTelemetry in Action: Resolving Real Banking Challenges
Follow the journey of an IT Ops team using vuApp360 and OpenTelemetry to solve critical issues, cut downtime, and keep customers happy.
Visibility Without Limits. Powered by Deep Data.
Unified Data Ingestion & Rapid Integration
Capture logs, and traces from any environment—on-prem, cloud, or hybrid, using OpenTelemetry SDK. Fast, zero-code setup and support for all major frameworks.
Auto-Discovery & Real-Time Service Mapping
Automatically map and visualize every service, interaction, and dependency. Monitor monolithic and distributed apps for instant context and seamless integration.
Deep Insights from Trace Telemetry
Spot performance bottlenecks across distributed applications. Correlate traces from service calls, APIs, and dependencies to quickly pinpoint errors and root causes.
Intelligent Observability. Accelerated Performance.
AI-Powered Issue Prediction
Predict incidents and identify bottlenecks with ML that analyzes metrics, events, logs and traces—spot outages before users are affected.
Stay ahead of slowdowns and failures with early warnings, not just alerts.
Automated Root Cause Analysis
AI-driven engine pinpoints root causes across distributed architectures—flame graphs and confidence scores highlight the real fix.
Go from millions of telemetry points to a single, clear action—no more guesswork.
Adaptive Performance Insights
Self-adapting baselines and anomaly models track health and performance across every service and unified journey.
Get visibility into emerging risks, even in custom, cloud-native, and legacy stacks.
Business Observability That Delivers Bottom-Line Results


As Perfios’ business continues to expand, there is a need for us to have a real–time view into the IT Operations and avoid any business disruptions. VuNet’s Business Observability platform’s real–time holistic visibility and proactive insights have helped us maintain operational efficiency. The platform has been considerably flexible, swiftly adapting to our evolving needs and ensuring seamless integration with our systems. It has enabled all our teams to collaborate effectively while delivering visibility to the leadership. We value their partnership and look forward to continued collaboration

I have been using the VuNet application since joining the company in July 2022. Initially, it was understood to be a tool for viewing logs, request and response payloads, and API error dashboards. Over time, I realized that VuNet has strong potential to prevent downtime and reduce customer impact when used effectively. It helps identify error patterns—what the error was and when it occurred—making it easier to decide the next course of action. This is critical for maintaining service uptime and addressing customer complaints. Overall, the application is user-friendly and has been especially helpful for someone like me who was new to the environment.
“VuNet’s Business Observability platform has transformed how we monitor our UPI application, making the process easier, more systematic, and highly efficient. It has significantly streamlined our operations, ensuring high availability and helping us reduce transaction decline percentages on the UPI platform.”
I would like to appreciate the efforts of your team on focusing and managing all the complexities of this project. Team effort on alert setting/reporting is very useful as It helped us to coordinate with our stake holders on various scenarios. After the discussion on every weekly call team's work on the discussed point to get that implemented quickly is commendable. Team helped in solving complex issue in timely manner. The way your team took it on and broke down this complex project into manageable pieces, helped everyone else.
We are able to proactively action on certain scenarios due to the great visibility VuNet provides with the logs, this was a hassle before as logs had to be collected from different location, compared against cases for RCA, this came out of the box. With VuNet, with bare minimum configuration we were able to aggregate the logs and the entire TAT reduced 3 times for issue identification and resolution.

VuNet’s big data analytics and monitoring platform, vuSmartMaps™ , was able to provide a single pane of glass across IT Operational and Business analytics. It was flexible enough to add and enrich other data streams including our business real time and offline data across various teams from loan origination to disbursement to provide a single source of truth and open enough to integrate with our internal Systems as well
%201.webp)
VuNet’s platform has achieved 75% optimization in time to identify incidents; VuNet is a key enabler in the Bank’s journey towards achieving its vision of 50% reduction in app down-time throughout its tech stack.
“VuNet’s solution really helped us to improve our online customer experience. It helped us to get proactive and resolve issues faster across our complex landscape of infrastructure, applications, and third-party API integrations. In place of multiple tools, we now have a single pane of glass of our KPIs and a unified front-to-back view of our customer journeys
%201.webp)
A command center view with a unified dashboard helping us controlling the applications, security, and infrastructure efficiently in a single click. Thanks to VuNet team for partnering us in this journey. A centralized cockpit that is giving us details on past, present and predicting the trend is awesome

VuNet's Business Journey Observability solution for our UPI Journey has been a game-changer. In the past, our visibility into transactions and failure detection was limited, leading to a direct impact on customer experience. However, with VuNet's platform, we now have real-time insights from infrastructure to applications – providing a comprehensive operational and business overview. As a result, the technical failures have reduced, directly translating to an elevated customer experience.”

"As we continue to engage with our customers who are increasingly using digital platforms, we wanted to provide them an error-free and uninterrupted experience. VuNet’s solution, vuSmartMaps™, is helping us do that and reinforcing the trust our customers have in us."

"The exponential growth in digital transactions and continued innovation in payment infrastructure also mandates end-to-end monitoring of systems for superior customer experience. Monitoring such systems at scale is extremely challenging but the digital transaction journey observability platform from VuNet is supporting the NPCI operations team gain full visibility into performance of systems, drive decisions and ensure reliability of service. VuNet is a key partner in our journey."