

VuNet’s vuSmartMaps™ stack introduces a domain context to observability and augments business journey to transaction metrics traceability across the stack of distributed systems in a digital-first world.
About this series: The Intelligent Observability blogs aim to elaborate upon the drivers of observability in modern complex systems, and how organizations can make the gradual transition to complete automation in their enterprises. You can find part 1 of the blog here, and part 3 here.
In the aftermath of the Covid-19 pandemic, we all have started taking better care of our health. There are diagnostic centres dime-a-dozen, willing to offer “annual physical check-ups” at throwaway prices.

The questions any physician asks you when you present the sheaf of reports for further analysis include, “Is there anything specific we need to be looking for? Is there a history of diabetes, cardio-vascular disease, cancer or hypertension on either side of your family?” The doctor is not asking these questions out of morbid curiosity – but for the need of establishing the CONTEXT in which these reports are to be seen. What are the blips or slight deviations to look out for? For instance, a fatty liver or elevated HB1AC count may not be alarming in and of itself, but given a family history of Type 1 diabetes, is definitely cause for concern and a trigger for early intervention.
Observability is similar. It gives IT Operations teams an idea of the general health of a system, but for taking root cause analysis and incident prevention a step further, it is imperative that we have an underlying business context in the light of which we are viewing all this data.

What Is Business Journey Observability?
Observability is primarily a tool to help developers, IT Operations and Site Reliability engineers(SREs) teams understand their system, troubleshoot, pre-empt problems, deploy updates seamlessly or improve run-time efficiency. However, there is always a business context that needs to be known, too. After all, a trace is triggered by an external request to the application. This could be, for instance, a customer initiating an online purchase or a money transfer request on a bank portal.
While the trace of this transaction records the function calls, APIs and internal states triggered by this customer request, the embedded business data - say the API intent and other attributes like merchant name, payment type, amount or geo-location - are typically not overlaid as trace attributes, and are for all practical purposes “lost”. Business data corresponding to successful transactions is recorded in the database. But transactions which fail for various reasons at intermediate stages only leave their fingerprints on the logs or traces. Conventional observability throws away this wealth of business information.
This is where business journey observability comes in. It gives observability a domain-centric flavour by tying events and data points that are collected across disparate silos and microservices in the context of a single business transaction. This includes failed transactions too, for it is from these failures that we get a wealth of information for root cause analysis that can possibly lead us to insights and AI models that can predict and prevent outages in the future.
Why Is It Important?
Our earlier blog on the Cost of Digital Payment Declines touched briefly upon the consequences of digital payments burgeoning in the last few years. Consider a small vendor selling groceries and vegetables from a pushcart. Most people today do not even carry a wallet – just a phone. The vendor makes her sale and points to a QR code linked to her bank account and the customer tries to remit the amount using a digital payment app like Google Pay. Uh oh – the transaction is declined, stating the bank’s server is busy. The customer tries again. The transaction fails again. The customer then walks ahead, planning to order the groceries online. But for the vendor this is tantamount to the loss of a few hundred rupees, a huge amount for her.
This loss can be avoided by “stitching” digital payments across the stack, so support teams can quickly piece together which steps in a particular transaction are slowing down or erroneous, and why. The contextual information captured by business journey monitoring allows us to answer other important questions too. For instance:
- Are the failures inside-out i.e., business KPIs getting impacted due to IT errors (timeouts, network errors etc.)? For instance, is a transaction slowing down due to database slowness?
- Are the failures outside-in i.e., due to business errors? Further, are the errors financial (authorization or fraud-check failures, items going out-of-stock, insufficient funds etc.)? Or are they non-financial – like failures occurring disproportionately for a particular merchant, from a particular bank, from particular geo-locations, or for larger payment amounts?
The insights that arise from the overlay of business data on tracing data also have a bearing on the key real-time objectives of IT observability - service remediation and pre-emptive RCA (Root Cause Analysis). Enterprises are under customer and regulatory pressure to minimize transaction failures – so the sooner warning signals can be detected and issues pre-emptively fixed, the better it is for business.
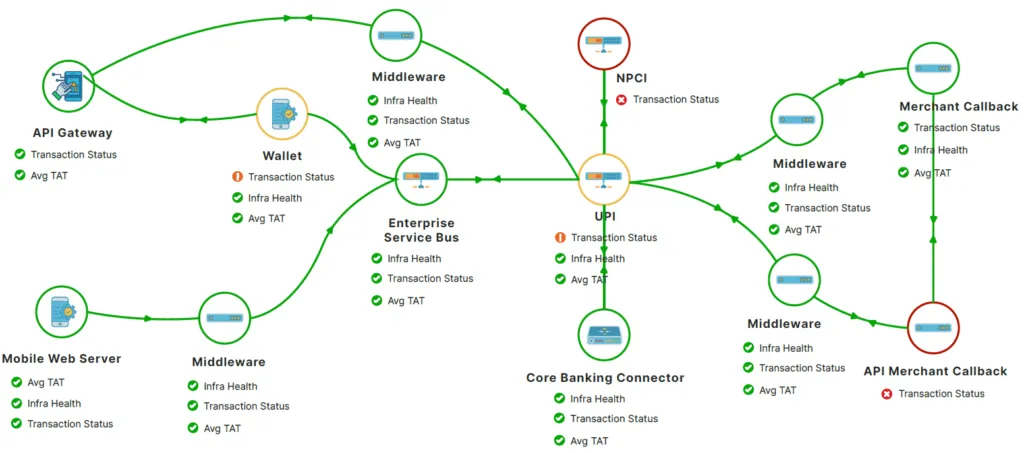
Fig: Journey View of Instant Payment in the Banking domain
Examples from the Financial Sector
A particularly important use-case occurs in the financial space - whenever there is a central entity interacting with its partners (stock market servers with brokers, flight reservation systems with travel websites, automatic clearing house with banks, etc). Business Journey Observability allows SRE teams of the central entity to notify a partner if failures seem to be unusually high for incoming requests from that channel, or from a particular merchant further upstream.
As another example, a payment aggregator with visibility into real-time failure rates for various payment methods can auto-suggest the most reliable one at that point in time to its customers. On the regulatory side, a banking regulator can periodically requisition summarized data of business journeys to ensure technical declines are not biased against smaller merchants, and shorter turnaround times (TATs) do not favour any particular channels.
Most importantly, failed transactions with business data overlaid also have other adjacent use cases around security- for fraud detection, risk scoring, or enforcing cooling-off periods on repeat failures, reconciliation, dispute resolution, and more.
How do we go about achieving Business Journey Observability?
We have all heard the phrase “diamond in the rough”. An uncut diamond has to undergo many processes before it attains the 5Cs that determine its value – cut, clarity, colour, carat weight and certification. In short, the diamond when mined is just another rock – the rigor that it goes through transforms it into the work of art we are used to seeing it as.

Data is similar. Logs, metrics and traces flow into an APM / Observability platform from myriad sources. What makes them actionable data is a series of processes that we at VuNet also call the 5Cs – Collection, Common Data Schema, Contextualization, Correlation and Consumption.
Collection:
This refers to agent-based as well as agentless methods to collect data (metrics, logs and traces) based on the OpenTelemetry standard. Data is ingested from various sources using adapters called vuBlocks, which can be customized to suit different data types and formats to make the collection process truly flexible and adaptable.
Common Data Schema:
The next step is to codify all the collected data into a well-defined information architecture. This is made possible through VuNet’s Common Data Schema (vuCoDS) -a JSON-based schema that focuses on the data consistency and quality. vuCoDS eliminates incompatibility in data flowing in from multiple disparate silos and creates a data lake, which is adaptable to any change in the domain workflow or business model. For example, a bank may decide to change the units of its digital transaction amount to be recorded in dollars instead of rupees. Automated data quality monitoring tools can detect such changes and tailor the schema on-the-fly to address them. These tools also take care of missing or duplicate values as well as data drift.
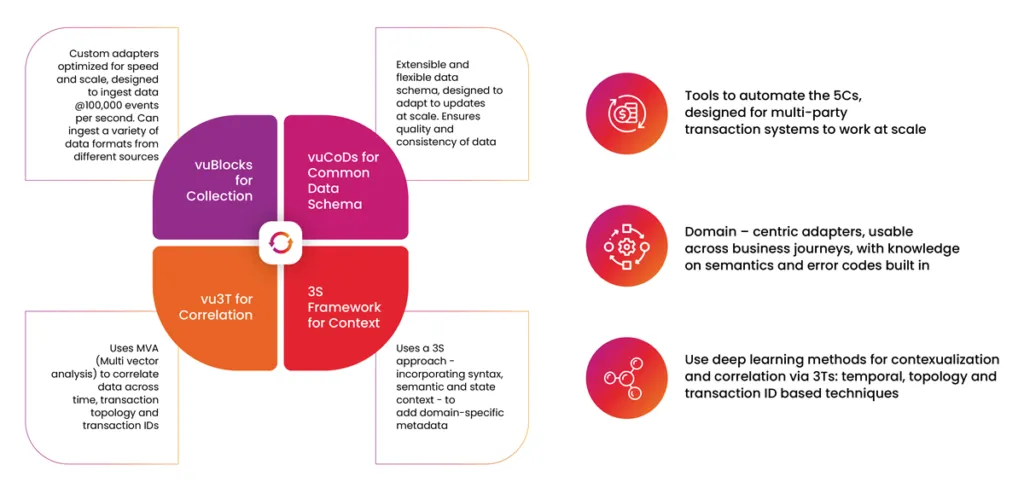
Fig: VuNet’s automated tools make the 5C process error-free, scalable and lightning fast
Contextualization:
This is the stage where domain-specific context gets added to the streaming data in real-time. A highly performant and scalable data pipeline using a “3S framework” adds syntactic, semantic and session states context to allow for richer, connected insights. For instance, for the banking domain, this is where metadata on the payment method, gateway, customer details and transaction details etc. gets added to the data schema. This metadata helps in drill-down and querying to create domain-specific dashboards which help troubleshooting teams pinpoint precisely where problems are occurring, down to a particular transaction, gateway, digital wallet or UPI platform.
Correlation:
Here is where the “secret sauce” of business data observability is added to the data mix. Each record needs to be “stitched” in the context of a transaction. This is easier said than done; digital payments, for example, are extremely complex in terms of the number of touchpoints they traverse and the number of external microservice and API calls they require. The response at each step is not synchronous, which means a mechanism is needed to correlate asynchronous requests and responses by detecting they are part of a single transaction. This is achieved through something we call the vu3T correlation framework, which is based on time, transaction ids or transaction topology. What is obtained at the end of this phase is a bird’s eye view of the entire transaction’s flow along with all the context it is associated with.
Consumption:
Smart storyboards and BI dashboards are created on this data via pre-defined templates and configurable widgets. It is possible to view alerts aggregated at a service level or based on different parameters like business error code, payment type, bank name, or even geo-location.
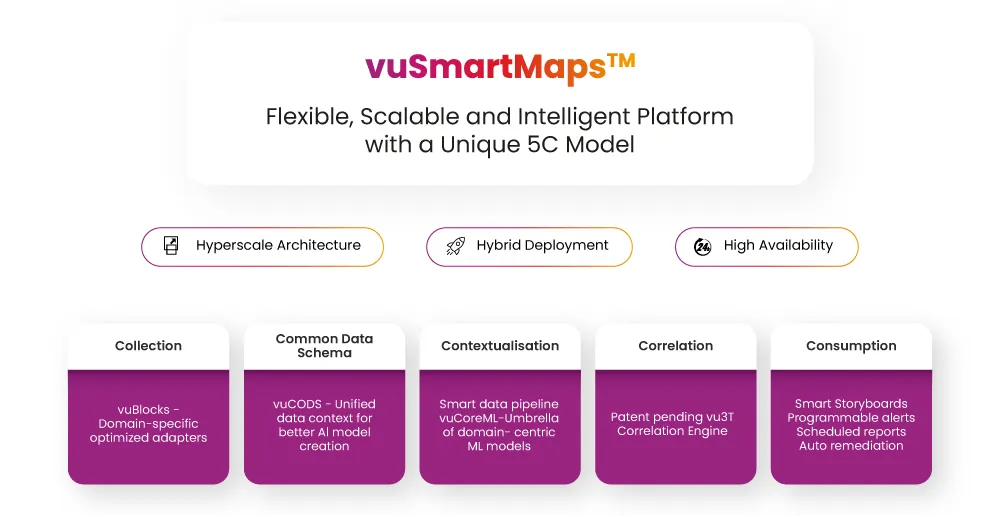
Fig: vuSmartMaps™ is a platform for AIOPs that is created via the 5Cs framework illustrated above.
Another key aspect for consumption is the creation of an information architecture, available through a platform called vuSmartMaps ™ that allows ML models to be trained and tested for various use cases like programmable alerts, early warnings, intelligent root cause analysis and pre-emptive remediation of issues. Our next blog will detail some of these use cases.
Conclusion
Business Journey Observability has become a necessity in the world going increasingly digital. From here on, transaction volumes are only going to increase exponentially and a robust mechanism is needed to enable automation in enterprises to deal with this growth. Handling scales of more than 10 billion transactions a month, VuNet’s domain-centric vuSmartMaps ™ stack brings together business journey observability and a unique AI/ML driven incident feedback loop to continuously accelerate your path towards intelligent operations and automation efficiencies. For more, read Part 3 of the Observability series – Sowing the seeds of MLOps in the soil of vuSmartMaps ™.