VuNet’s vuSmartMaps™ stack introduces a domain context to observability and augments business journey to transaction metrics traceability across the stack of distributed systems in a digital-first world.
About this series: The Intelligent Observability blogs aim to elaborate upon the drivers of observability in modern complex systems, and how organizations can make the gradual transition to complete automation in their enterprises.
The first blog of the series introduces the concept of Business Journey Observability, a paradigm that injects much-needed domain intelligence into your observability use cases. In the course of this process, VuNet creates a rich, robust, scalable and highly available information architecture called vuSmartMaps ™ that will ultimately allow complete adoption of AIOps and automation in your enterprise.
Sam had planned his parents’ 50th wedding anniversary perfectly – the guests, the hall, the caterer, and the piece de resistance - a limited-edition hand-carved wooden replica of a Lambretta scooter - the exact make and model his father had taken his mother for their first “date” on! He clicked on the Buy button on the last piece left on the online marketplace, picturing his parents’ face when he would hand over the gift to them. Suddenly, the dreaded failure message popped up: “We are sorry, but your current payment method could not be processed. Please contact your financial institution and try again”. Sam received a debit notification via SMS and immediately contacted his bank – the amount was too huge to try paying again, without knowing more about what was going on.
After myriad IVRS menus, Sam could finally speak to a human, and explained the problem. Maya, the bank’s customer service representative, was suitably contrite. She simply did not know why the transaction had failed, but confirmed that the amount had indeed been debited. She could see no error sent from the payment gateway other than a nebulous status message saying “Processing”. However, she promised Sam that if the payment was not processed within 24 hours, the amount would be credited back to him.
Sam decided to try buying the item one more time using a different payment option. To his dismay, the item was sold out by then. He received his refund within 48 hours, but it was a hollow victory. Without the perfect gift, he felt the party was still incomplete.

What was the point of the above story? Well, buy your gifts well in advance, for one! But whose fault was it that Sam had a bad customer experience? Both Maya and Sam did everything right. Then, what went wrong?

Traditional APM does not work anymore!
Traditional APM or Application Performance Monitoring relied on a set of metrics collected from a North-South deployment architecture – Web, App, DB, Storage, with a load balancer and network switches and routers added to the mix. Logs provided detailed records of events in the environment, and were the primary source of information for troubleshooting if anything went wrong. The 3rd pillar of monitoring was transaction traces, which can be loosely described as the stitched-up record of a single transaction as it flows through the stack - starting with the external request and ending with a successful response or transaction failure.
Our earlier blog on “Why an integrated view of North-South and East-West flows of applications is key for unified visibility?” touched upon the complexity of monitoring via logs, metrics and traces in distributed systems with heterogeneous deployment environments. Application monitoring tools need to adapt to changing environments.
With the introduction of cloud virtualization, there are increased east-west traffic flows, (interactions with multiple microservices, applications and infrastructures), which result in problems for support teams. Traffic has become increasingly difficult to monitor on the cloud, and dashboards are inundated with data and alerts from multiple heterogeneous systems without adequate context to piece it all together. Traditional monitoring systems have proven woefully inadequate in terms of correlating all these data points in a cogent way that aids root cause analysis and faster issue remediation.
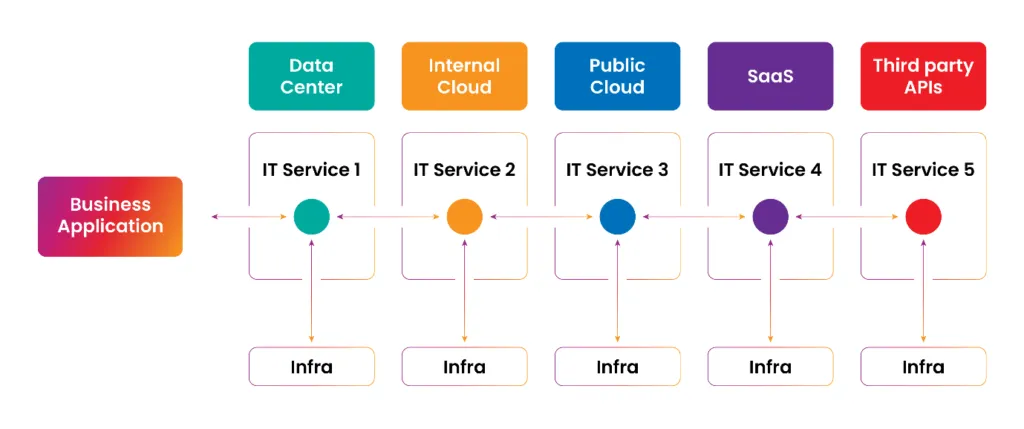
Fig: A modern enterprise business application architecture complexity.
The result? Frustrated and demotivated support teams who are barely able to meet targets on MTTD (Mean Time to Detect) and MTTR (Mean Time to Resolve). And equally frustrated end users who have no idea why their transactions failed.
How would Observability have changed the above interaction?
Sam and Maya were both affected by a common underlying cause: the lack of VISIBILITY into the payment gateway’s inner workings.
In complex distributed systems, there are a lot of moving components that change the system landscape dynamically. For example, a container orchestration platform like Kubernetes can spin off dynamic service instances based on the workload on the system. However, dynamic scalability means that there will be an uncertain number of instances running for a service at any point in time. This makes the job of collecting, curating, and storing the system output like logs and metrics difficult.
Further, it is not enough just to understand what is happening within applications of a system. For instance, the problem may be in the network layer or the load balancer. Then there are databases, external storage devices on the cloud, messaging platforms, and so forth. It's important that all these components are observable at all times.
Moreover, request-response mechanisms in these systems are mostly asynchronous, so it is not easy to “stitch” or correlate transactions based on sequential or synchronous request-response pairs. As a result, it is difficult to pinpoint the source of the anomaly and say which service in the system is causing the bottleneck, escalating as performance degradation.
This is where OBSERVABILITY – a new paradigm for visibility in a complex distributed system - comes in.
So, what is observability anyway, and how is it different from monitoring?
Observability relies on the internal state of the system being inferable from the inputs and outputs of the various components of a system. It means that from the outside-in perspective that monitoring offered, there is a shift to an inside-out way of implementation.
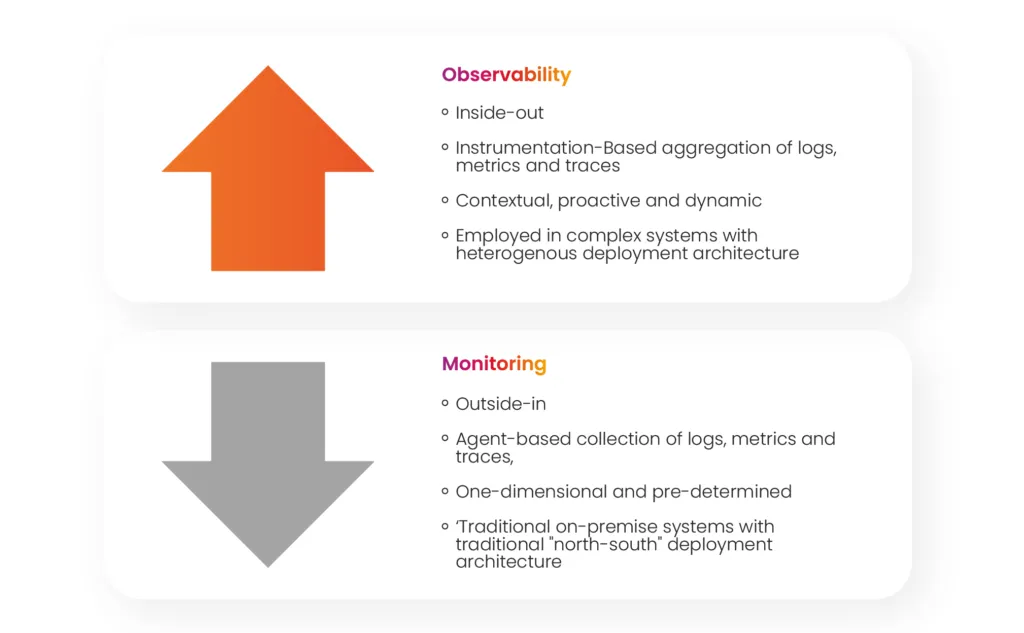
Fig: Observability vs. Monitoring
Every service needs to be developed in order to BE OBSERVABLE. It needs to adhere to OpenTelemetry, OpenTracing and OpenLogging standards so metrics, traces and logs can continue to be captured. It needs to have well-documented APIs which return intelligible responses, with which other services can understand why a particular leg of a transaction did not perform as expected.
For instance, in Sam’s case, if Maya had received a more meaningful error message from the payment gateway’s API stating that the payment was unsuccessful because of server maintenance issues, she could have reassured Sam to go ahead with an alternate payment method or another payment gateway immediately, because there was a guarantee of him recovering the amount paid in the prior (failed) transaction.
While observability goes one step ahead of monitoring, there is also the need to present all this data in a fashion that troubleshooting teams can comfortably consume. Earlier, monitoring dashboards spewed out all the log/metric/trace data they were able to capture, with associated anomalies/ alerts, if any, on each. It was up to a human to collate this data and make sense of it in the context of an ongoing issue.
Unified Observability attempts to mitigate this problem. It promotes the actionable use of data by enabling a holistic view across the entirety of a technology stack. It also aggregates all the data produced by all the IT systems to logically group metrics and logs at a service or issue level. It creates dashboards and visualizations that correlate and aggregate anomalies or alerts to present them in the context of issues, and helps teams determine their root cause and proactively resolve them.
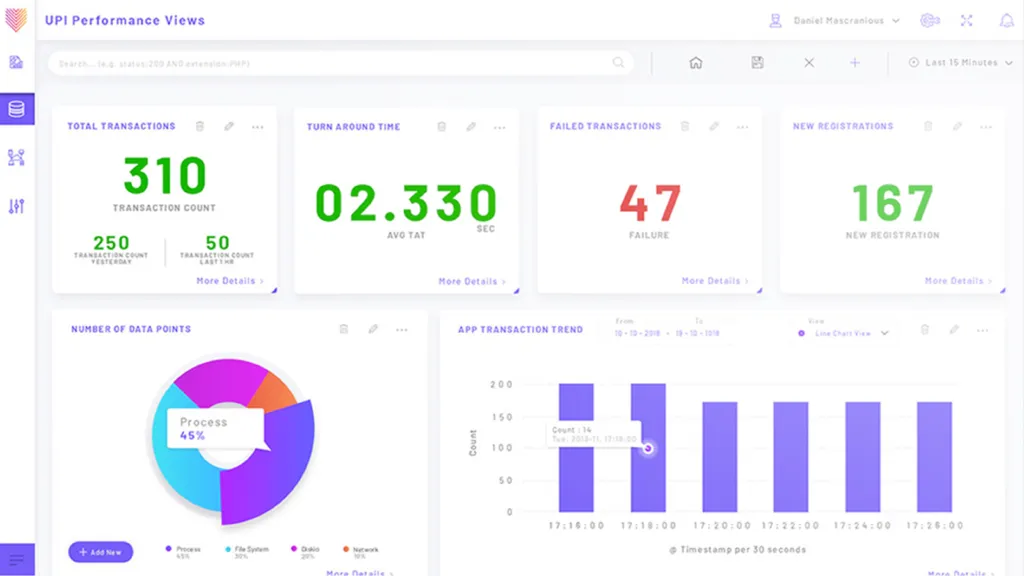
Fig: Example of service-level dashboard based on Unified Observability
The ultimate goal of Unified Observability is to ensure that the enterprise IT stack is AVAILABLE and is PERFORMING RELIABLY and WITHOUT ERRORS.
What next?
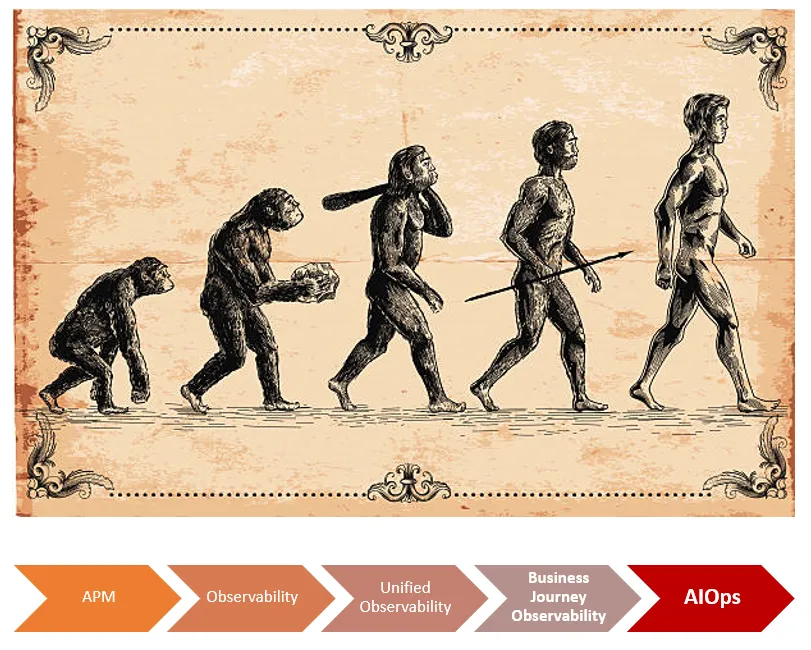
The below infographic illustrates how an enterprise can drive maturity in their IT operations to eventually adopt complete automation.
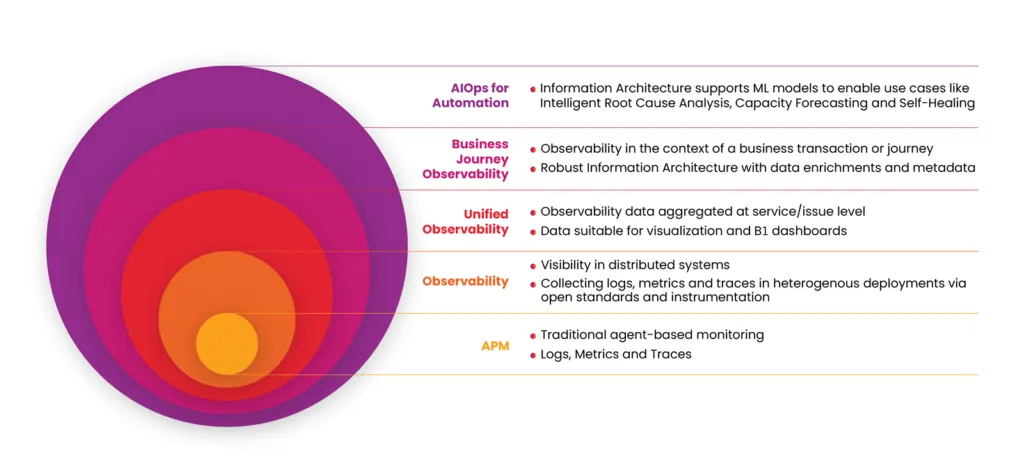
Fig: Driving maturity in IT Operations
Why is this evolution the need of the hour?
Digital payments are rife with complexity in terms of the number of touchpoints a simple transaction traverses. For end users, it is as simple as a click of a button; but behind the scenes there are a plethora of third-party API calls and responses that factor into the success or failure of the transaction, and not all of these are visible to the monitoring entity – in the above case, Sam’s bank. As stated above, each component in a distributed system needs to be “visible” for observability to work.
Our earlier blogs on the Cost of Digital Payment Declines and Unravelling UPI spoke about the need to stitch transactions across the stack, so support teams can quickly piece together which steps in a particular transaction are slowing down or erroneous, and why. Enterprises are under customer and regulatory pressure to minimize transaction failures – so the sooner warning signals can be detected and issues preemptively fixed, the better it is for business.
This leads us to the next step in this journey (pun intended!) - Business Journey Observability, which gives Unified Observability a domain-centric flavour. It enables CONTEXT in observability, by tying events and data points that are collected across disparate silos in the context of a single business transaction. While observability gives IT Operations teams an idea of the general health of a system, intelligent root cause analysis and incident prevention can be realized only when we have an underlying business context in the light of which we are viewing all this data.
A trace is always triggered by an external request to the application. This could be, for instance, a customer initiating an online purchase or a money transfer request on a bank portal. While the trace of this transaction records the function calls, APIs and internal states triggered by this customer request, the embedded business data - say the bank name, merchant name, payment type, amount or geo-location – also need to be captured. This includes data for failed transactions too, for it is from these failures that we get a wealth of information for root cause analysis that can possibly lead us to insights and AI models that can predict and prevent outages in the future.
Conclusion
Essentially, Business Journey Observability is an organization’s next step towards complete enablement of AIOps and Automation in the enterprise. Business Journey Observability creates a rich dataset that provides the basis on which AI/ML models can be built to enable advanced AIOps use cases. Handling scales of more than 10 Billion transactions a month, VuNet’s domain centric vuSmartMaps ™ stack brings together business journey observability and a unique AI/ML driven incident feedback loop to continuously accelerate your path towards intelligent operations and automation efficiencies! But more on that later, so stay tuned!