
A look into the strengths, limitations, scaling, sampling and data enrichment considerations while evaluating OpenTelemetryAs an Observability platform, we are always looking for what we internally call “Observability Gaps”. Over the years, we have built a framework that has three questions that help us identify these gaps. And in my opinion, if you use an Observability tool, you should ask these questions as well.
- Are you able to determine at any given moment whether your systems are meeting their SLOs?
- Are you able to pinpoint RCA?
- Are you able to identify the “unknown unknowns”?
If the answer to any of the above questions is “NO”, then you have an Observability Gap. And more often than not, implementing OpenTelemetry can help you fix it.Now if you need a primer on OpenTelemetry, let me recommend reading my previous blogpost that went into the fundamentals of OTel.

Why OpenTelemetry?
Democratized Data Collection
Historically, every Observability vendor had their data collection system. They provided libraries into an ever-expanding landscape of the technology ecosystem. Keeping a diverse set of libraries up to date became a huge overhead and squeezed resources that could be better utilized in data processing or analysis. Thus came the advent of OpenTelemetry, which relieved Observability vendors and consumers from the headache of data collection as it allowed you to seamlessly collect traces, logs and metrics.
Vendor Neutrality
This democratization of data collection also enables customers to not depend on a single vendor. The fact that you don’t have vendor’s agents instrumented in your application allows you the flexibility to open yourself to other options. But we have often noticed the narrative that stresses how OpenTelemetry truly allows customers to be vendor-neutral. While the standardization of data collection is a contributing factor, we believe that it cannot be your central argument for exploring alternatives.
Ability to Send Data to Multiple Tools
Before OTel, in the wild wild west of data shipment, you had to adhere to the pre-existing standards and compliances of specific applications (think a SIEM platform) or build APIs that would allow you to connect to various applications. Once again this was another area of overhead where resource utilization was skewed.But with OpenTelemetry, you can easily send data to multiple platforms be it SIEM, Observability tools, or data management.
Types of Instrumentation
Automatic Instrumentation
The auto-instrumentation libraries are available for different languages. If your language is supported, you just need to add the tracing library to your application and restart the application.No code changes are required. This adds instrumentation to the libraries.
- Full Auto Instrumentation: This doesn’t require any code changes to the application.
- Partial Auto Instrumentation: This doesn’t require any code changes to the application to instrument it. But requires code changes to initialize the OpenTelemetry libraries
The following programming languages support automatic instrumentation - Java, .NET, JavaScript, Python, PHP
Manual Instrumentation
This is an advanced instrumentation. This method can be used if your language is not supported by auto instrumentation. Here, the developers can add the tracing APIs into the application and add code to generate the traces. This provides deeper instrumentation but code changes are required.We can manually instrument in the following languages - C++, Go, Ruby, Rust, SwiftThe support for manual and auto instrumentation plays a critical role in identifying the feasibility of observability.
Limitations in OpenTelemetry
Level of Maturity
The maturity of libraries for various languages differs within OpenTelemetry. For example: Java libraries are quite mature on OTel while in my personal experience, we found limited libraries available for C/C++.When it comes to non-standard libraries, you can go for library instrumentation. To do library instrumentation it is essential to know “how that library works”.
Focus on Manual Instrumentation
For certain programming languages, like the ones we highlighted above, you have to go for manual instrumentation.With auto instrumentation, you can configure libraries, while manual instrumentation helps you in modifying your application code for critical data.You can still configure the Java agent to capture spans around specific methods using the configuration “otel.instrumentation.methods.include”.
Performance
Perhaps a less discussed aspect, any form of instrumentation would have an overhead on your performance. Having a clear understanding of its impact is always recommended. Over the years we have done multiple load-testing experiments and have concluded that instrumentation adds 2% overhead on your application performance.
Tail Sampling
When you are monitoring any transaction, they would create a huge volume of documents and trails and you cannot store every transaction coming into your application. Hence, across Observability platforms, we do a sampling of incoming data for practical analysis. While there is no formula for what percentage of samples you analyze; often the decision is made through thorough evaluation and understanding of the criticality of the application.But how would you compensate for selection bias? If root cause analysis is your objective from data collection, it is essential to capture all traces with errors or high latency.Now there are two types of Sampling
- Head Sampling – Where sampling is done early in the lifecycle of the transaction.
- Tail Sampling – Where sampling is done at the last possible moment before the transaction is captured in a data store/Observability platform (like we do here for vuSmartMaps).
We prefer Tail Sampling because it allows you to better capture failure rates and high-latency transactions. Which goes without saying, improves your application performance.
Scalability
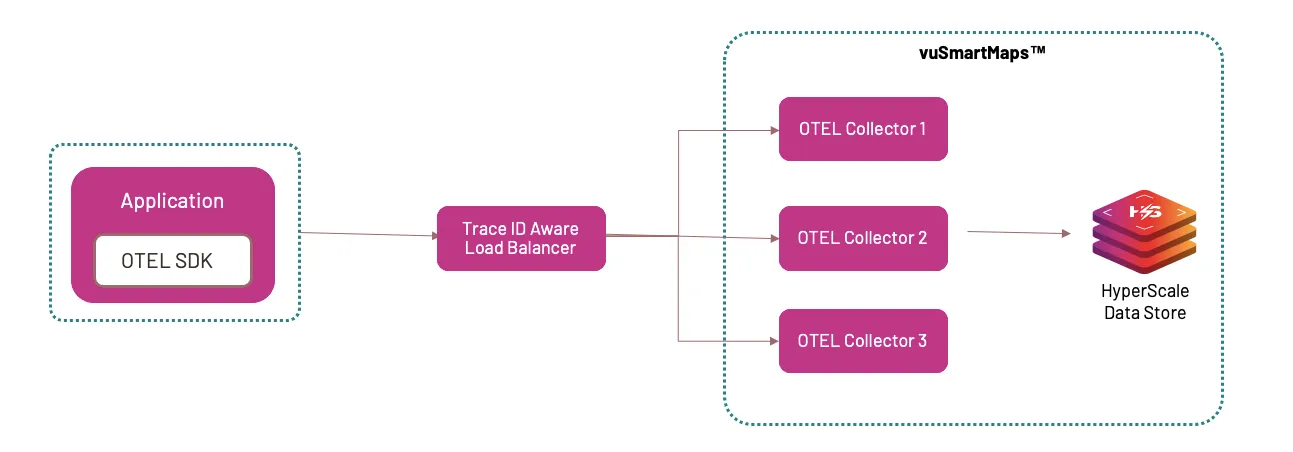
In vuSmartMaps, we have an OTel collector that receives all the traces. Now it's essential to ensure that the OTel collector can scale by the incoming data. There are multiple approaches you can go for
Static Scaling
Here we do load testing to understand the maximum capacity of the OTel collector. Based on the results, we horizontally scale to ensure there are enough instances for incoming traces. The challenge with this approach is that you need very thorough capacity planning in place
Clustering
Here you segment incoming data and move them to OTel collectors.The challenge with this approach is that the data often comes to the OTel collector in batches. And given that a Trace ID can have multiple spans (legs within the transaction), they all will have different span IDs. Now it's quite possible that given data is sent in batches, the span IDs are segregated across multiple batches and can end up in different OTel collectors making it difficult to make sampling decisions.The solution is to have the gateway collector deployment pattern that consists of applications sending telemetry data to a single OTLP endpoint provided by one or more collector instances running as a standalone service, typically per cluster, per data center or region. This is a two-tiered setup with a collector that has a pipeline configured with the Trace ID/Service-name aware load-balancing exporter in the first tier and the collectors handling the scale out in the second tier.
Data Enrichment
For incoming transactions within the OTEL collector we can use “Transform Processor” to enrich fields of transactions. For incoming transactions, the transform processor allows you to keep specific fields, filter or drop unwanted data fields (that saves storage cost), or add additional fields (for example: adding server names to IP addresses or User login details to URLs coming via API)
Correlating Traces with Logs
Logs can be correlated with the rest of the observability data in a few dimensions
By the time of execution
Logs, traces and metrics can record the moment of time or the range of time the execution took place. This is the most basic form of correlation.
By the origin of the telemetry (Resource Context)
OpenTelemetry traces and metrics contain information about the Resource they come from. We extend this practice to logs by including the Resource in LogRecords.
By the execution context (Trace Context)
It is a standard practice to record the execution context (trace and span IDs as well as user-defined context) in the spans. OpenTelemetry extends this practice to logs where possible by including TraceId and SpanId in the LogRecords. This allows us to directly correlate logs and traces that correspond to the same execution context. It also allows to correlate logs from different components of a distributed system that participated in the particular request execution.These 3 correlations can be the foundation of powerful navigational, filtering, querying and analytical capabilities. OpenTelemetry aims to record and collect logs in a manner that enables such correlations.It is also possible to inject trace information like trace IDs and span IDs into your custom application logs.For Java applications - the following libraries support this
- Log4j1
- Log4j2
- Logback
For JavaScript applications, the following logging libraries support this.
Conclusion
Circling back to the three questions at the beginning of this blogpost, it's often necessary to keep revisiting these questions to determine the efficiency of your Observability platform and plug “Observability gaps”. Within the realm of Application Observability, OpenTelemetry offers tremendous flexibility and solutions to address your bottlenecks right from scaling, to enrichment to performance analysis. At VuNet, this has helped us build a Business Journey Observability platform allowing us to offer a unified view of your entire application ecosystem.