

A primer on OpenTelemetry and how it simplifies the process of tracking and understanding the performance of software applications.

What is OTel?
OpenTelemetry, or OTel, is an open-source, vendor-neutral framework designed and incubated by the Cloud Native Computing Foundation (CNCF) to help developers and operators instrument, collect, and analyze telemetry data from software applications. It comprises a set of tools, APIs, and libraries that enable developers to capture and propagate context, generate traces, and collect telemetry data from their applications.
The primary goal of OpenTelemetry is to standardize observability instrumentation across programming languages and frameworks, supporting the collection of the three Pillars of Observability – logs, metrics, and traces - so developers can monitor and troubleshoot applications in real-time.
OpenTelemetry is a merger of two previous projects: OpenTracing and OpenCensus. By combining these projects into a single, unified framework, OpenTelemetry aims to provide a consistent and comprehensive solution for observability across cloud-native environments. It is widely adopted in the industry and supported by major cloud providers, observability platforms, and open-source communities.
In Part 1 of our OTel series, we examine the brief history of the evolution of OTel in the context of the shift to Observability from Application Performance Monitoring tool, how OTel works, and the benefits that OTel brings to observability through vendor-agnostic telemetry capture and cross-platform consistency.
A Brief History of Telemetry, APM and OTel
APM revolves around telemetry, the automated process of remotely collecting and transmitting data using agents and sensors. Telemetry gathers a variety of metrics, including performance data, error rates, traffic volume, latency, and resource utilization, to offer insights into system behaviour. While telemetry focuses on data collection, it is distinct from monitoring or observability, as it doesn't inherently provide insights but relies on other tools for analysis. However, telemetry serves as a foundation for monitoring and observability, supplying data that APM and observability tools leverage to understand the system's state at any given time.
APM focuses on observing and measuring an IT system's health and performance to ensure it functions as expected, by setting up predefined checks and alerts on telemetry data to detect potential failures and deviations from expected behaviour. Yet, it often lacks the depth and flexibility of observability, particularly for complex, multi-API cloud-native applications. There is an increasing need to provide a comprehensive view of such systems to help DevOps teams perform swift root cause analysis and correlation in a way that goes beyond simple monitoring. This necessitates a shift to observability.
Along with the transition from APM to Observability, telemetry also needs to evolve to empower observability platforms to understand a complex multi-cloud system's internal state and behaviour based on available data. Enter OpenTelemetry – a standardized, vendor-agnostic way to provide observability platforms with the three pillars of telemetry data they rely on – Logs, Metrics and Traces.
How does OTel Work?
Code Instrumentation 101
Code instrumentation serves as the cornerstone of telemetry data collection, providing the necessary insights into the behaviour and performance of software applications. By embedding monitoring and tracing capabilities directly into the codebase, developers can gain real-time visibility into how their applications operate in production environments. This proactive approach to instrumentation enables DevOps and IT Operations teams to capture critical telemetry data, including metrics, traces, and logs, allowing for comprehensive monitoring, troubleshooting, and optimization of applications.
Instrumentation relies on integrating specific code snippets, logging statements, or hooks into the application. Instrumented code provides valuable insights into resource usage and bottlenecks, empowering developers to optimize performance across various scenarios. It also assists in understanding long-term resource requirements and facilitating effective capacity planning to ensure the infrastructure can handle expected loads.
In distributed systems, code instrumentation becomes especially critical for creating distributed traces. These traces follow requests through services and components, offering a comprehensive view of the system, tracking request flows, and facilitating faster root cause analysis. Developers can proactively identify and address performance issues and prevent disruptions that could impact users.
The Standardization of Instrumentation with OTel
OpenTelemetry enhances observability by standardizing the collection and instrumentation of telemetry data across distributed systems. It provides a consistent set of APIs and libraries that developers can use to instrument their code, ensuring that telemetry data is captured uniformly across different environments, programming languages and frameworks. Additionally, OpenTelemetry supports integration with a wide range of observability platforms and data stores, allowing developers to choose the tools that best suit their needs.
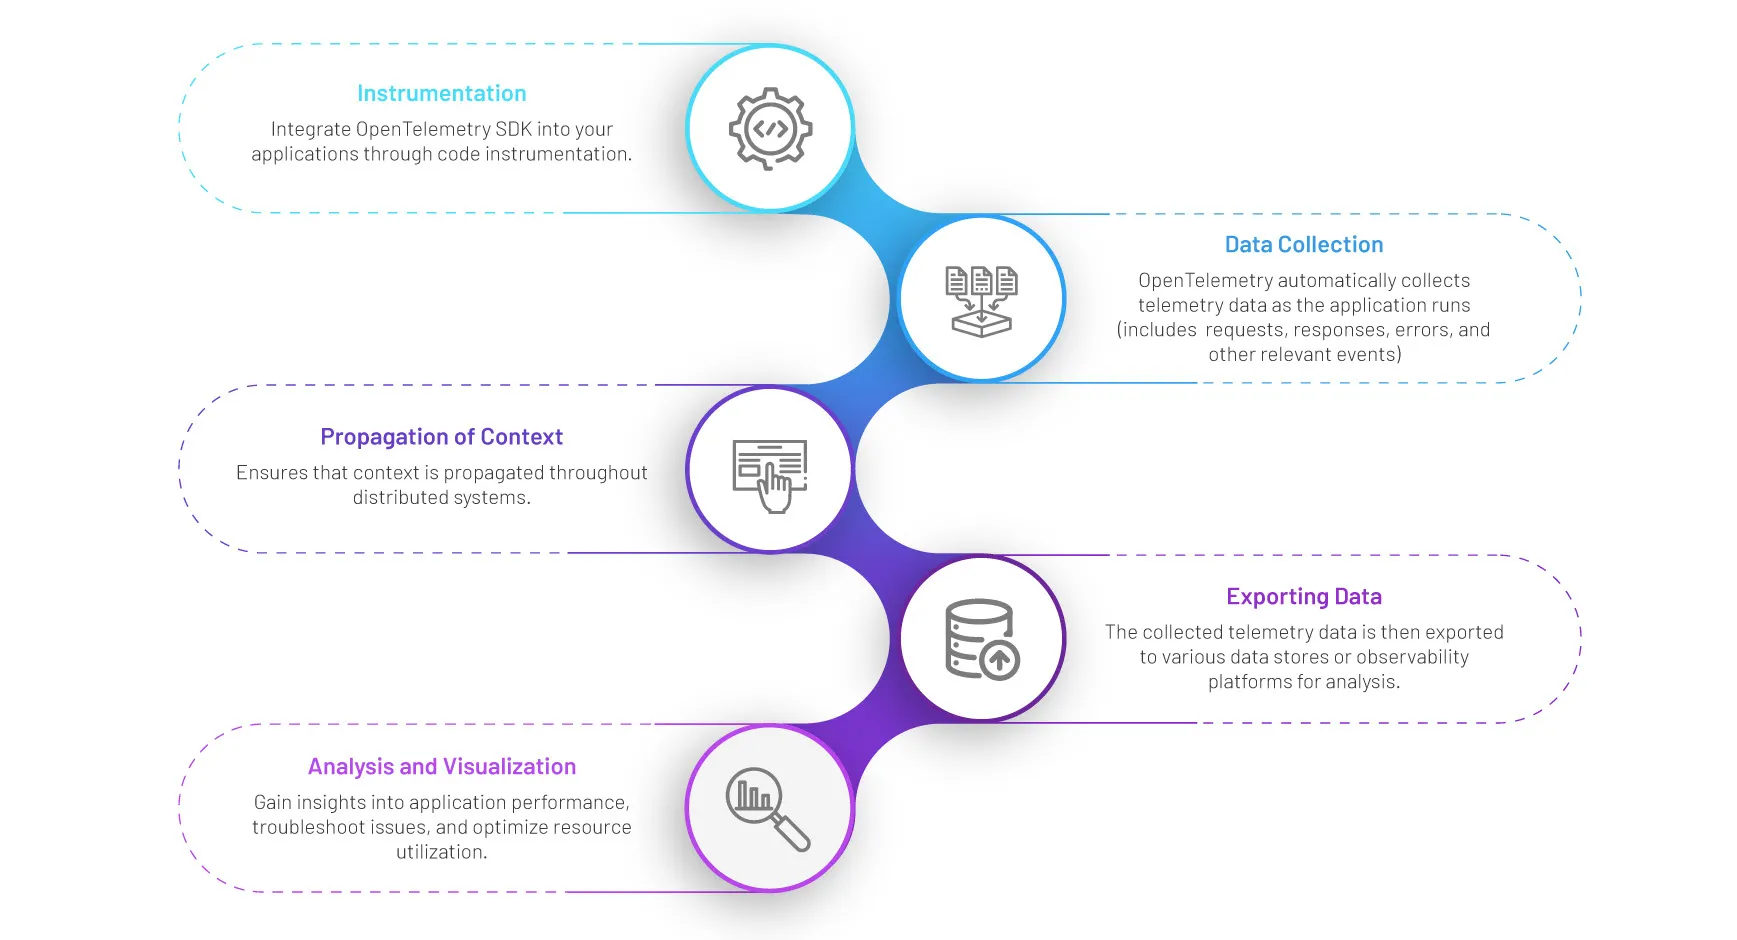
Here's how OTel typically works to integrate Observability into an application performance software:
- Instrumentation: Developers integrate the OpenTelemetry SDK into their applications by adding code instrumentation. This involves adding specific code snippets or libraries to their codebase that capture relevant telemetry data, i.e.: logs, metrics and traces.
- Data Collection: Once the instrumentation is in place, OpenTelemetry automatically collects telemetry data as the application runs. This data includes information about requests, responses, errors, and other relevant events occurring within the application.
- Propagation and Context: The Context object contains the information for the sending and receiving service to correlate. This contains the traceId, spanId, traceFlag / SamplingInfo and baggage object. Propagation is the mechanism that propagates the context object from one service to another. OTel uses the W3C Trace Context standard as the default propagator. By default, OTel uses the traceId and spanId in the context. Using this we can track the application flow through different applications/services. This doesn't have the baggage object. This baggage object contains the custom key/value pairs. If the client is doing the manual instrumentation they can add the transactionId, RRN etc in the context through baggage. So, by default (and in all cases) context propagation is enabled by OTel using tracId and spanId. If needed, we can add the customer/application-specific information to be propagated across the services using manual instrumentation.
- Exporting Data: The collected telemetry data is then exported to various data stores or observability platforms for analysis. OpenTelemetry supports a wide range of exporters, allowing developers to choose the backend that best suits their needs.
- Analysis and Visualization: Once the telemetry data is exported to the chosen data store, developers and operators can analyze and visualize the data to gain insights into application performance, troubleshoot issues, and optimize resource utilization.
The OTel Advantage in Observability
Using OTel in observability offers several advantages:
- Standardization: OTel provides a standardized framework for capturing telemetry data, making it easier for developers to instrument their applications consistently across different languages and frameworks.
- Vendor Neutrality and Interoperability: Before the establishment of standardized methods for collecting application telemetry data, client engineering teams using monitoring solutions had to manually instrument applications or rely on the instrumentation libraries provided by the solution vendors to meet their specifications. This process often required significant time and effort, especially when switching between monitoring solutions from different vendors, as engineers had to install the respective instrumentation agents for each solution. However, with OTel, developers can seamlessly integrate with a diverse array of observability tools and platforms, enabling them to leverage their current infrastructure and tools more efficiently.
- Comprehensive and Transparent Data Collection: OTel supports the collection of all three pillars of observability—logs, metrics, and traces—in a transparent manner. This is important because DevOps teams prefer having complete control over the data they push and the ability to penetrate production servers, gaining full visibility into the application's performance.
- Real-time Monitoring: OTel enables real-time monitoring of applications, unlike the sampled approach typically adopted by APMs, allowing developers to track metrics, traces, and logs as they occur and quickly identify and respond to issues.
- Support for Distributed Tracing: A crucial requirement for observability in complex, cloud-based systems is distributed tracing, which is one of OpenTelemetry's core capabilities. OTel allows developers to instrument their applications to generate traces that capture the entire journey of a request as it traverses through various microservices, APIs, and other components. This is particularly crucial in multi-cloud and multi-API architectures, where a single user request might trigger a cascade of interactions across multiple services spanning disparate silos. OpenTelemetry provides tracing SDKs for most programming languages like Java, Python, Javascript, Golang, etc. Trace data enables you to visualize and understand the path of a request, providing end-to-end visibility and making it invaluable for troubleshooting and improving system reliability.
OTel with VuNet Systems
VuNet Systems' innovative product, vuApp360™ , utilizes the OTel approach to instrument code. Supporting various programming languages, including Java, Go, .Net, and NodeJS, vuApp360™ seamlessly integrates OTel tracing libraries into applications, collecting trace data and sending it to vuSmartMaps™.
With vuApp360™, users can trace requests and transactions within both monolithic and microservices-based applications. Deep visibility into API calls and individual span levels allows for efficient software development and issue resolution. Additionally, when combined with business journey monitoring via vuBJM™, vuApp360™ enables faster root cause analysis.
Other benefits of vuApp360™ include one-time instrumentation even during vendor changes and intelligent programmable alerting, converting business logic into proactive alerts. Its user-friendly and highly configurable storyboards offer context-rich insights for swift understanding and action. Moreover, vuApp360™ automatically plots the application topology map, visualizing application flow and customer journey paths, enhancing overall system understanding.
In part 2 of this series, I would like to share more of a practitioner’s view of OTEL. I will share the key considerations that went into selecting Open Telemetry, but also some Observability Gaps. I will also share considerations around sampling, scaling and enrichment.