In this blog post, I would like to uncover the capabilities of vuApp360. Application Monitoring has advanced in parallel with the evolution of platform architecture. In the past, we have discussed how the east-west traffic flow (interactions with multiple applications and multiple infrastructures) as opposed to the traditional north-south direction (flow through App/Web/DB server within an application), which has presented more visibility problems for IT. Delivering an integrated journey view into the length and breadth of the architecture is the fundamental basis for Observability Platforms and this is possible through correlation of logs, metrics and traces.
But when it comes to monitoring application performance, organizations still come across critical challenges. In the majority of the platforms, you still have to manually instrument i.e. developers painstakingly need to add APIs, code, or log statements to gather specific insights into the performance and behavior of a system. Another flipside of such instrumentation is that in the future it becomes extremely difficult to decouple these agents from the applications. A lot of platforms don’t associate critical services they monitor with the business functions of applications which means you have a very fragmented view of your application performance. There is no correlation of traces within your application with logs or infrastructure metrics. Hence Business Journey View is out of the question.
With vuApp360, our objective is to bring correlation between your application traces with infrastructure metrics, network and system logs.
vuApp360 – OTEL-based Application Observability Platform
At VuNet Systems, we have built vuApp360 around Open Telemetry which enables auto-instrumentation. You can configure the Traces O11ySources libraries once and the intelligent agent will collect comprehensive telemetry data from any application without manually changing its code.
Auto-Discover Applications and Services
Once Traces O11ySource is configured, you will automatically discover and map components of your applications, service interactions (first or third party) and dependencies. No matter if it’s a standard application or a complex microservices architecture. We call this feature ‘Service Map’. Service Map visualises how different services interact with each other and critical applications in real-time. You can hover over each service for an instant view of Service Summary: a snapshot of the health metrics of each component.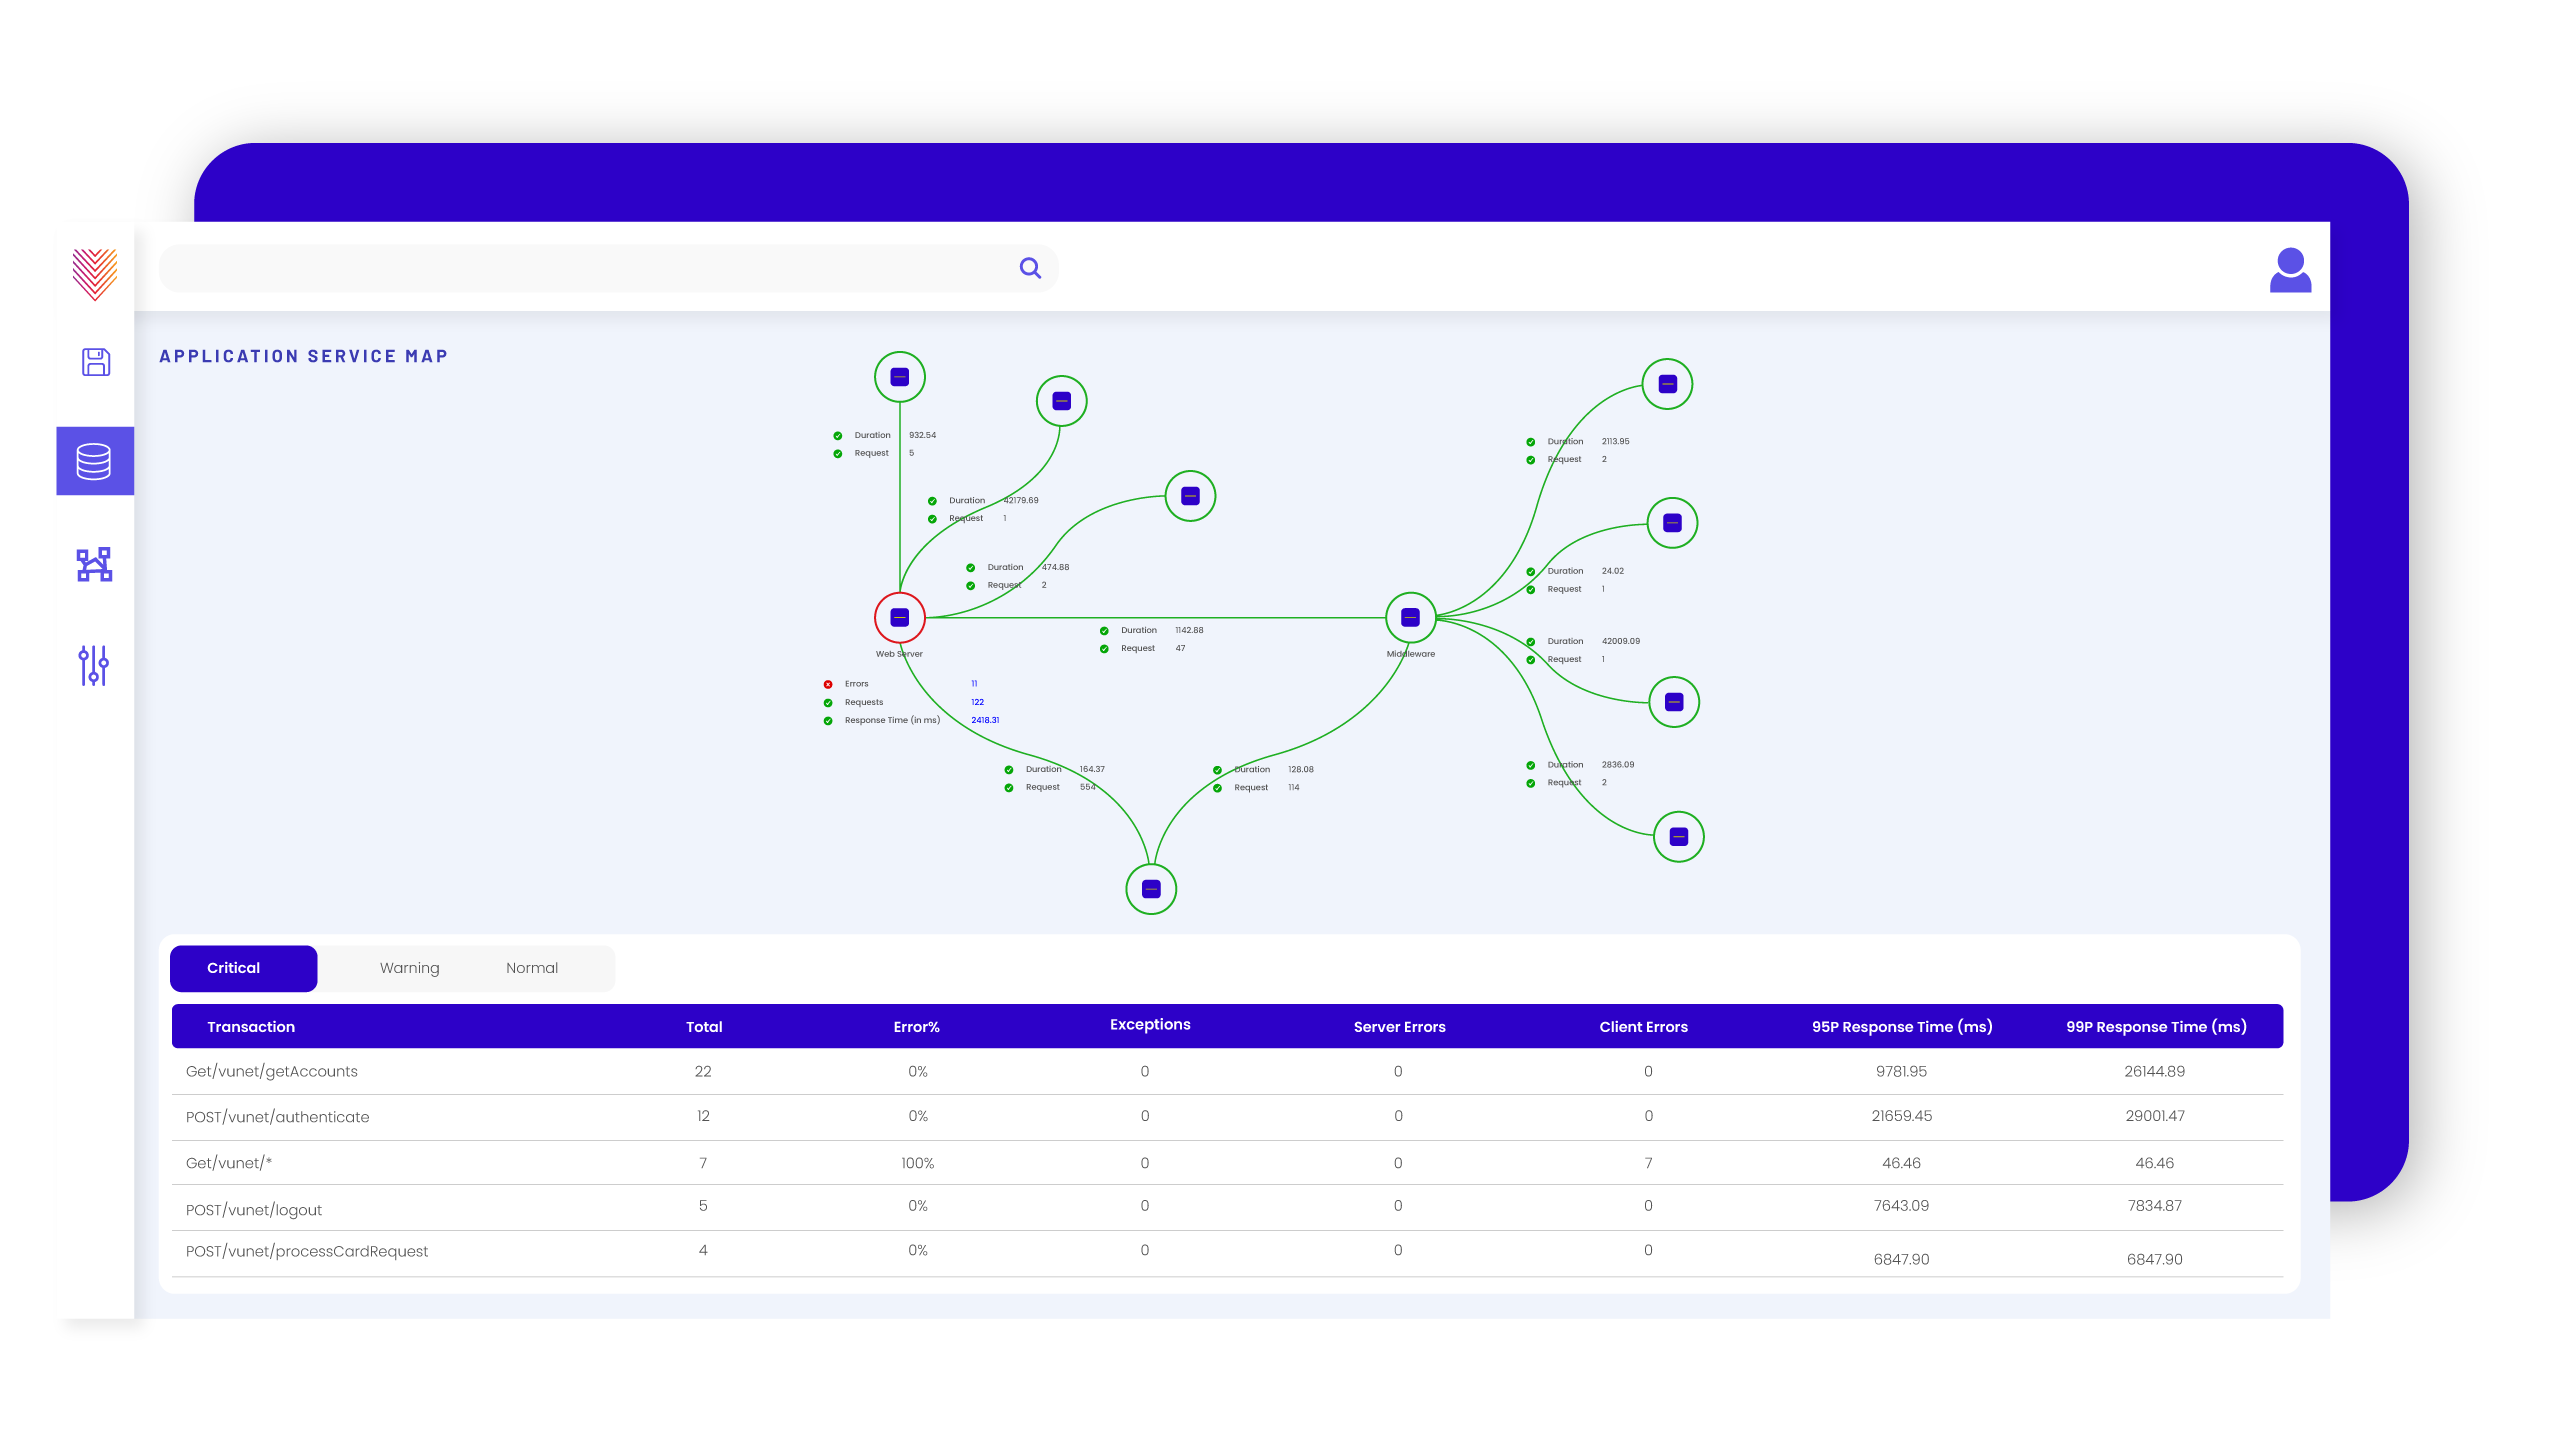 We have benchmarked an average of 50 – 80K EPS (Events Per Second) enabled across 6 OTel collectors
Service Catalog
VuApp360’s Service Catalog is a repository that allows you to manage service ownership at scale. This becomes another avenue to identify dependencies and version changes in complex, microservice-based applications.
This is critical in eliminating knowledge silos. Like during incidents, you can immediately pinpoint the service causing the interruption.
Comprehensive Insights at Your Fingertips
VuApp360 stands out by offering a bird’s eye view of complex application landscapes. It enables users to maintain vigilant oversight of application performance, swiftly identify and rectify issues, and enhance application efficiency. With VuApp360, you can optimize resource use, ensuring peak performance and customer satisfaction. Here’s a closer look at the product capabilities that make this possible:
Key Application Metrics Tracking
VuApp360 meticulously tracks vital application metrics such as request rate, error rate, and duration (RED). The RED metrics are crucial for understanding your application’s performance in real-world scenarios, allowing for timely adjustments and improvements.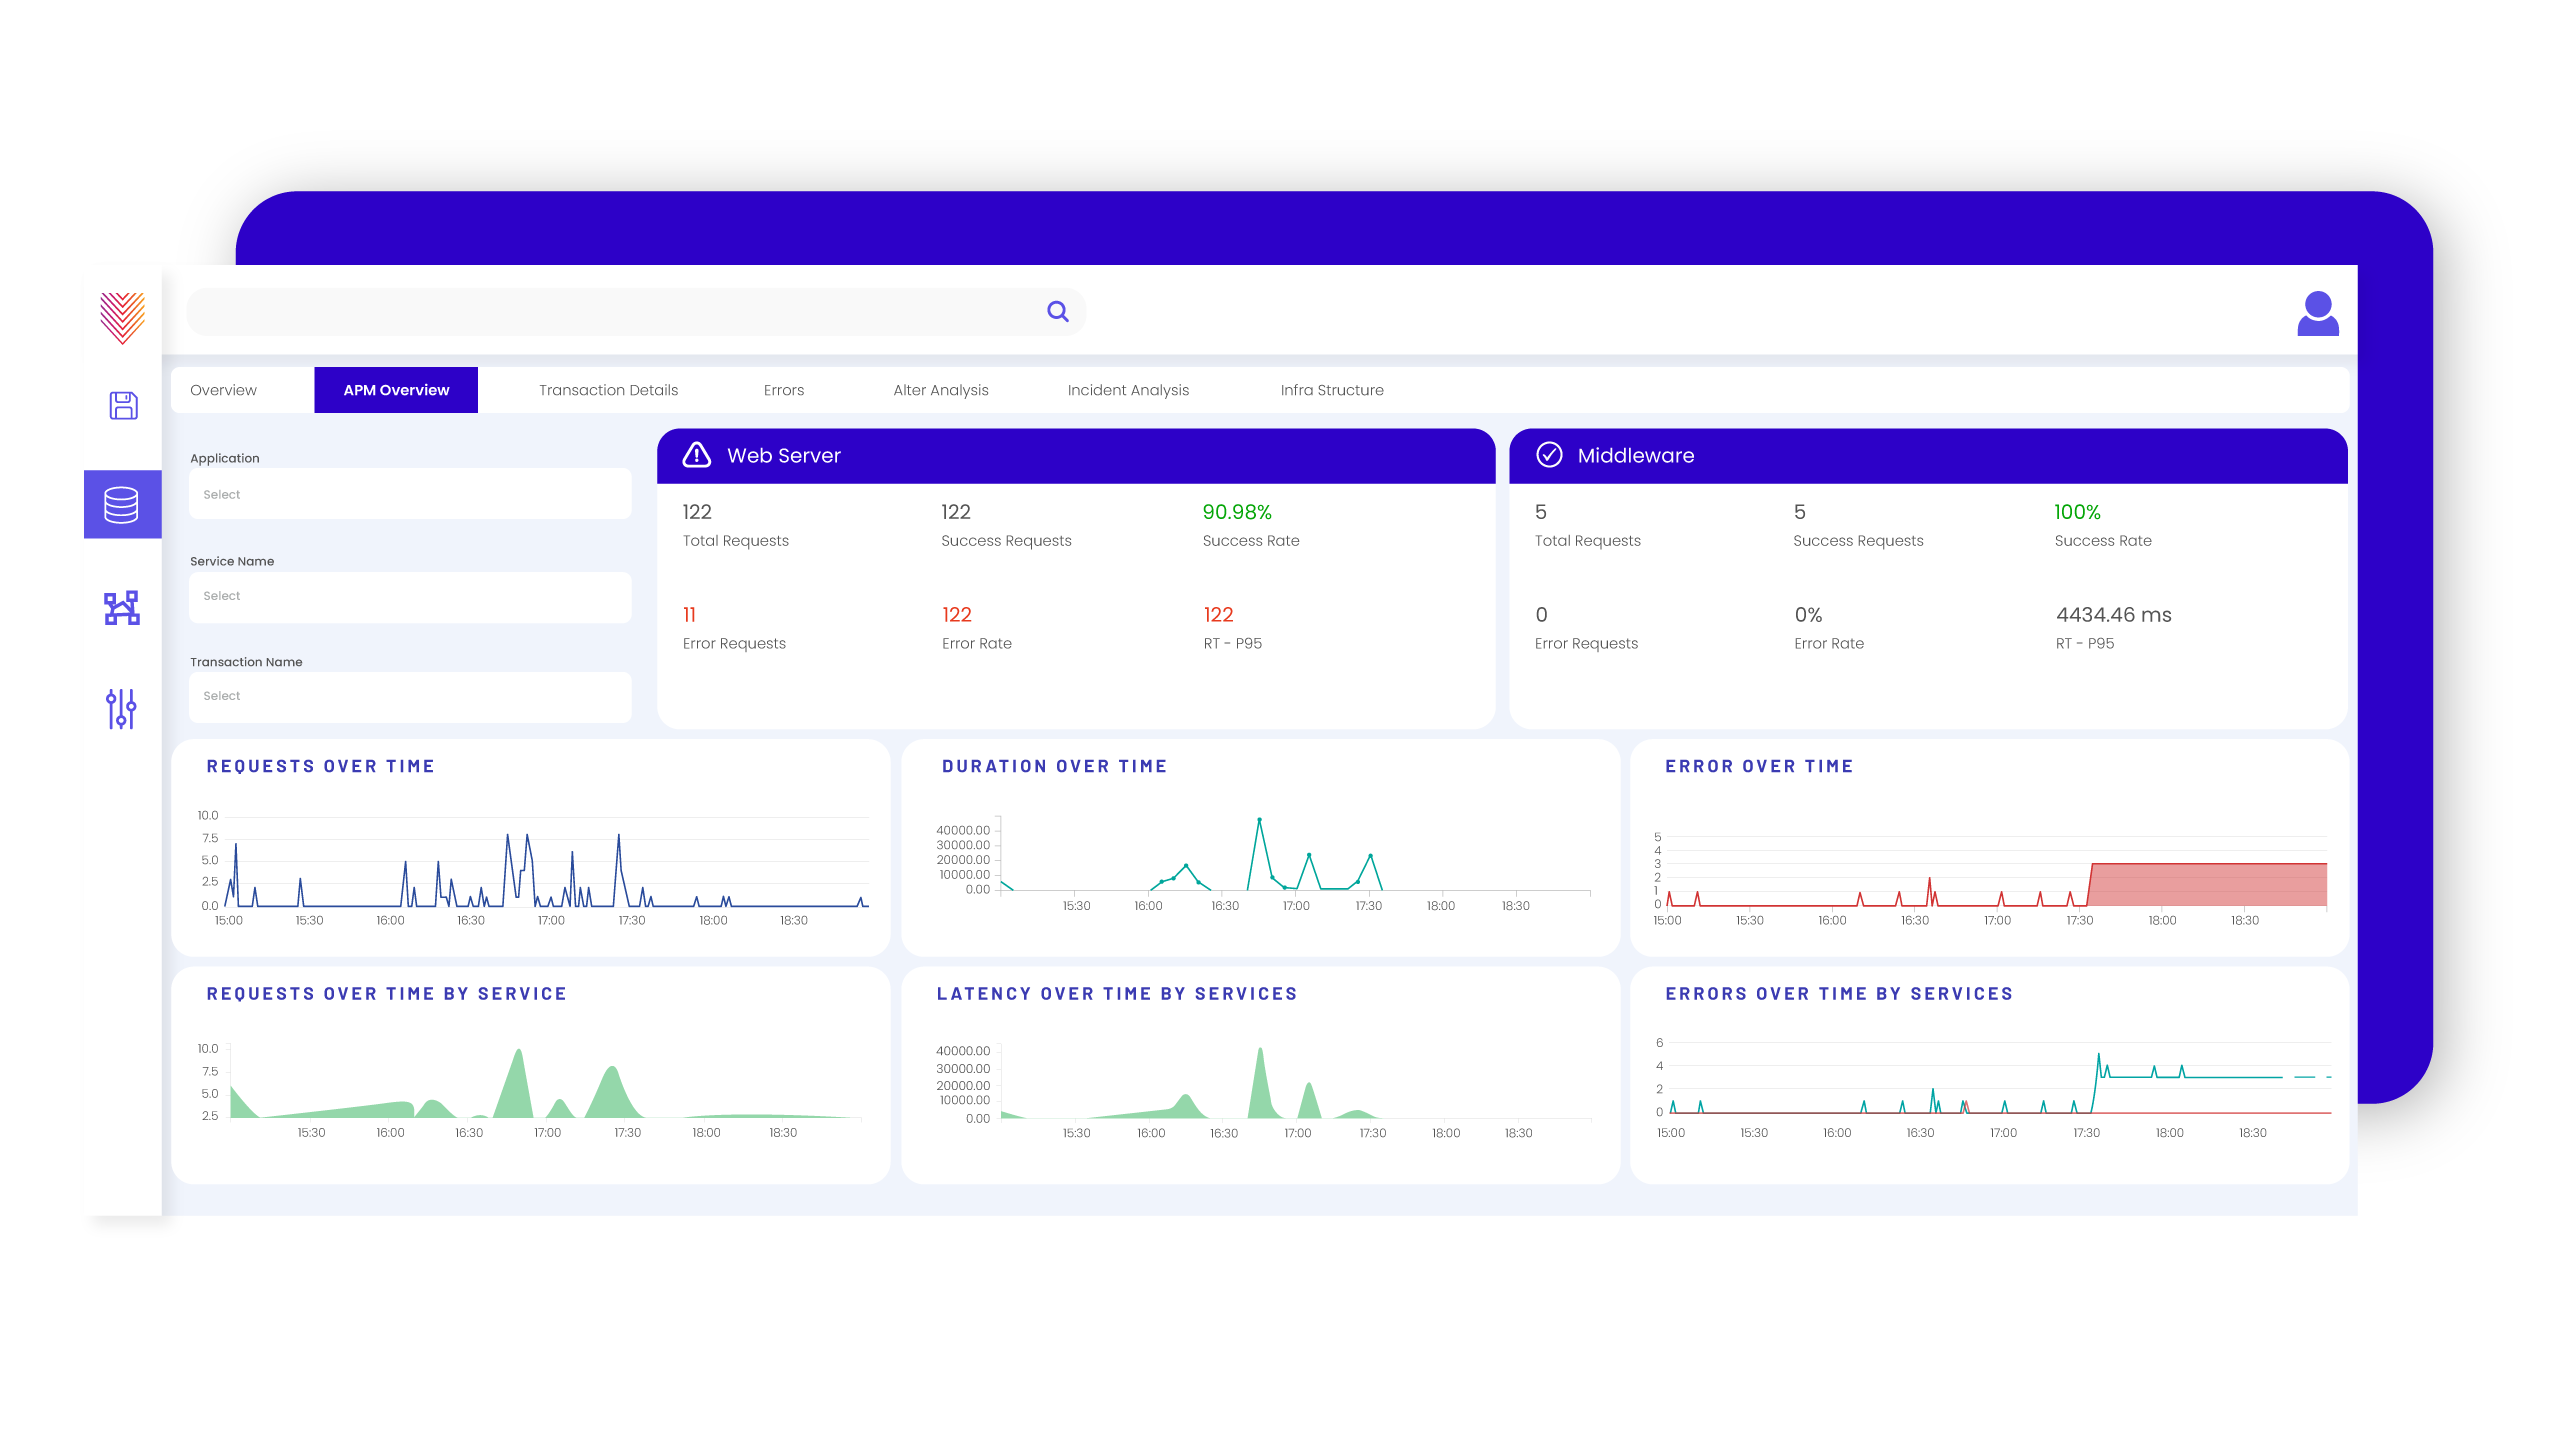
Site-Level Analysis and Service Association
The platform offers site-level analysis, enabling users to assess application performance based on location. This feature is particularly beneficial for global applications, ensuring users receive optimal service worldwide. Additionally, VuApp360 simplifies the association of services to applications, making it easier for CXOs to analyze the business impact of performance metrics.
Distributed Tracing for Precise Insights
You can trace every transaction across your ecosystem and aligned with our automated insights it allows you to easily identify the root cause during incidents. You can make data-driven decisions based on the segmented view of trace information. For example, you can look at span metrics to identify which leg of a trace is unresponsive and causing latency in the application.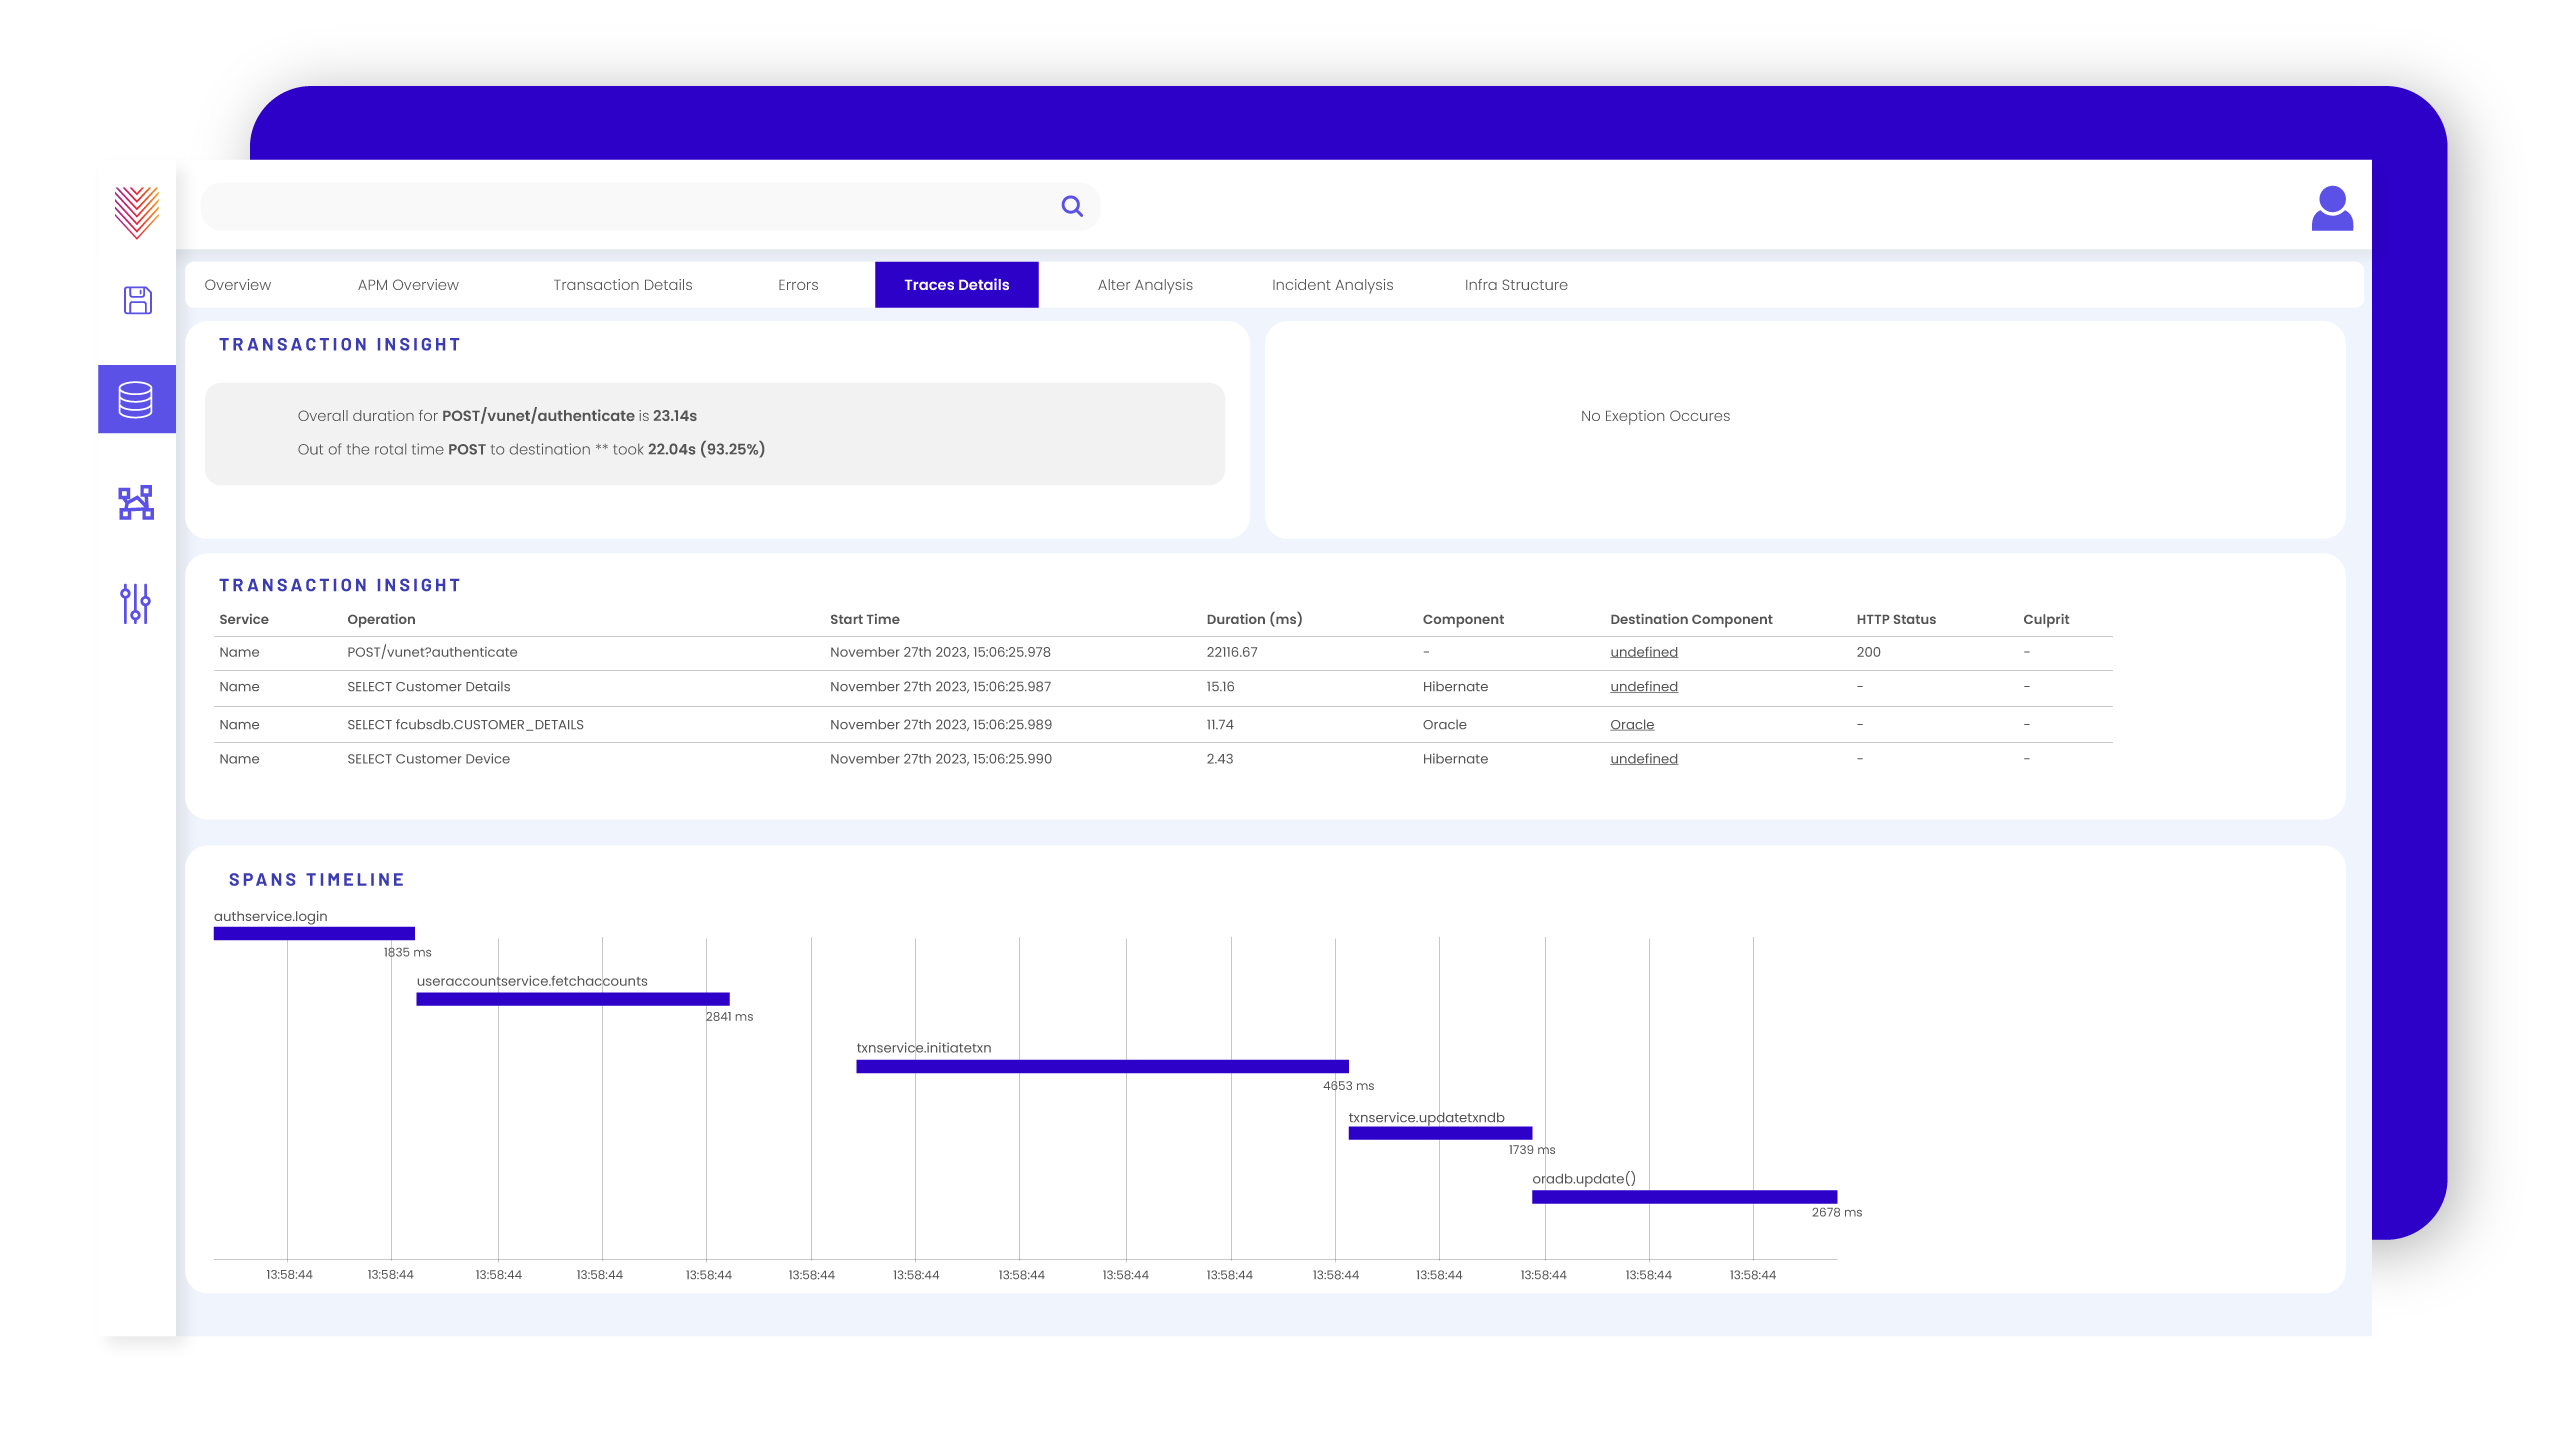
In-Depth Analytical Tools
With its list and graph views (Flame Graphs), VuApp360 allows users to drill down into application metrics for a more detailed analysis. This depth of insight is invaluable for identifying and addressing specific performance issues.
Alerts, Reports and Dashboards
No observability tool is complete without its ability to deliver critical insights into the application ecosystem promptly. This includes
- Critical alerts are designed based on thresholds on duration, error rate, request rate etc. If an application stops actively sending data, we have a proactive alert called No Data Alert.
- Anomaly Alerts – Automated alerts are generated based on abnormal conditions within the system. It helps you identify unusual behavior in advance.
- You can set up weekly reports – Application Quality Report and Application Catalog Quality Report
- You can easily set up custom views for your dashboards. But our recommendation would be to build a dashboard focusing on critical RED metrics about your application.
Key Benefits of VuApp360
- Real-time Observability: Get a unified snapshot of service metrics, deployments, errors, latencies, and incidents.
- Faster Resolution: Quickly identify failed or delayed transactions to reduce mean time to detect (MTTD) and mean time to resolve (MTTR).
- Increased Stability and Uptime: Ensure your application delivers the superior performance you intended.
- Accelerated Software Releases: Empower your DevOps team to efficiently manage application interactions and dependencies.
- Boosted Code Quality: Enable your development team to debug and refine code, enhancing overall application quality.
VuApp360 is designed to always help you exceed your performance expectations. It’s designed to keep the latest understanding of expectations and the evolution of application monitoring in mind.