
Monitoring Challenges of Modern IT Applications
Modern IT applications deliver substantial business value. At the same time, they magnify IT team’s support burden. Progress is never free, and in the case of micro-services and distributed systems, the business reaps the benefit while IT pays the price because there is not enough observability to keep pace with the complexity across the entire stack.
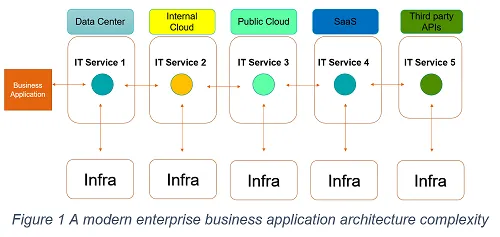
As illustrated in Figure 1, internally hosted in the data centre or private cloud, public cloud-hosted, or software-as-a-service applications interacting with third-party APIs comprise a significant and growing majority of today’s business applications landscape. They are transforming the ways in which enterprise-class applications are built, deployed, consumed, and managed. The use of public and private cloud environments by organizations around the world continues to grow at a rapid pace and shows no signs of abating in the near future.
Microservices are a software architecture pattern used to decompose monolithic applications into smaller services that do one thing well and are built and managed independently. They do not have to be aware of technical details of services developed by other teams but can consume them via strongly defined APIs. Microservices offer a form of organizational speed, scale and agility via distributed systems technical architecture.
In the modern application architecture, there might be fifty-plus applications that actually have microservices running at any given time, which can impact availability of a business-critical application. If it turns out a small percentage of users are unable to transact certain parts of the business application in a given hour, it’s quite challenging to identify which IT services may have actually caused that problem. Even more challenging is that, in many cases, it may be an external service. A third-party API may be causing five-millisecond latency increase week over week over a three-month period. If you ignore the small deviations and fail to proactively address them, you may be greeted with a big outage.
The introduction of cloud virtualization has increased east-west traffic flow (interactions with multiple applications and multiple infrastructures) as opposed to the traditional north-south direction (flow through App/Web/DB server within an application), which has presented more visibility problems for IT. And as workloads moved to the cloud, traffic grew even more obfuscated, making traditional monitoring tools even less effective.
As with any problem management effort, enterprises begin to look at monitoring data. Most commonly used monitoring technologies and techniques are: application performance management, log analytics, metrics, distributed tracing, cloud infrastructure, network monitoring tools and such. It turns out enterprises discover that they have thousands of data sources, telemetry, incident management metrics, deployment metrics and on and on. In fact, when there are so many monitoring data sources to look at, it makes deciding what data to look at and in which order to tackle the problems, tricky. Static thresholds in monitoring tools creates alert storms for the operations teams.

Unified Visibility of Monitoring Data
There are many ways to simplify visibility and speed troubleshooting. Perhaps the most fundamental is building observability—with both metrics and structured logs—into each component from grounds-up with platform enablers as we discussed in an earlier blog post. The modern monitoring approach calls for a grounds-up built platform stack where infra logs, events, metrics, traces, APMs and big data can coexist along with application and transaction logs to add domain and business context.
Unified visibility across application, infrastructure and transaction which correlate the alerts with dynamic baselines instead of static thresholds is the need of the hour.
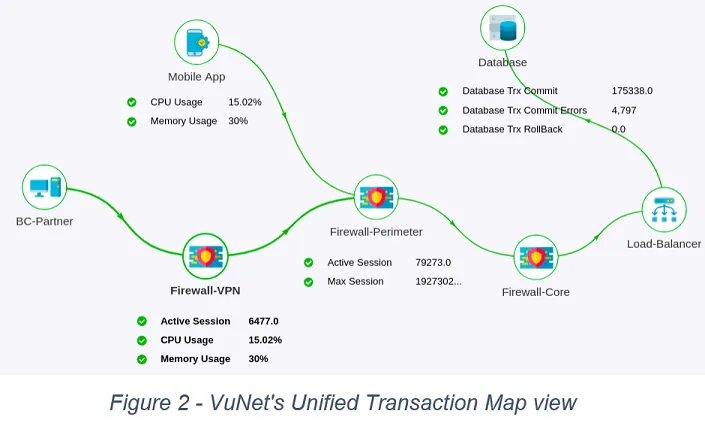
Application and operations teams need a unified visualization which provides a functional flow diagram of distributed application components interacting with a network, application or transaction, not just the north-south flow of a transaction but also the flows across east-west. vuSmartMaps™, VuNet's Business Observability platform provides such unified visibility that shows:
- Interconnection map of logical components and key metrics for each node and link. Here node refers to the logical component of a technical architecture and link refers to the connection between two logical components (nodes) (Figure 2)
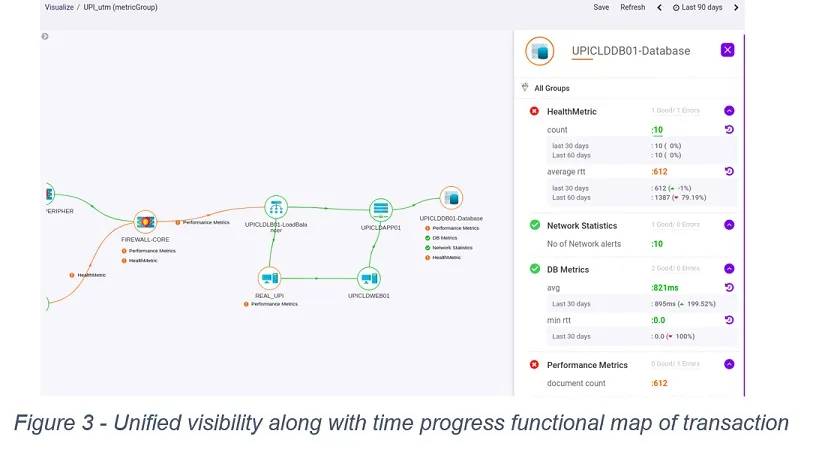
- Time progress functional map of transaction legs of a business transaction (Figure 3)
With integrated data sources providing unified visibility, two categories of storyboards can enable insights for business and IT operations teams as shown in Figure 4:
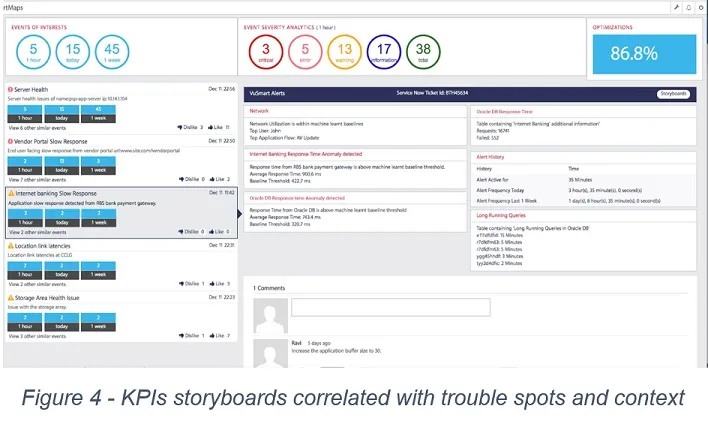
- KPI dashboards that provides top level health and performance on each and every sub system
- Detailed storyboards with correlated information across touchpoints that can be used for transaction level analysis
We know that every minute of downtime matters. If you don’t know about your customer pain, you can’t begin the process of trouble shooting. That is where correlated alerts across the entire tech stack becomes important. In the world of IT operations, Time to Detect (TTD) and Time to Repair (TTR) are two key metrics to track. VuNet’s VuSmartMaps™ holistically helps IT operations address TTD and TTR metrics by implementing a workflow as shown in Figure 5.
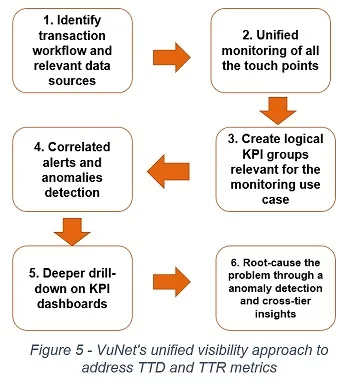
Step 1: Identify transaction workflow and relevant data sources for the business application
Step 2: Unified monitoring of all the touch points ( north-south and east-west flows)
Step 3: Create logical KPI groups relevant for the monitoring use case
Step 4: Correlate the alerts with appropriate context based on anomaly detection
Step 5: Enable deeper drill-down on KPI dashboards to facilitate understanding of KPIs to underlying systems behaviour
Step 6: Enable root-cause the problems for remediation
Key Takeaways
- Unified visibility with real-time dashboards is the bread and butter of IT operations. Every application, every service, every component needs to be able to see in real time where they are doing well, where they can improve and what they can fix quickly. This means creating dashboards with KPIs that can pivot by service, even down to the transactions that make up the overall customer experience.
- Getting insights through unified visibility means curating a fair bit of data in your enterprise and your Observability platform needs to be able to facilitate it.
- Think of your Observability platform as your internal product to meet the monitoring and analytics needs of not just today's but tomorrow’s as well.
✍ Srikanth Narasimhan, the author of the article, is a Technical Advisor @ VuNet Systems. He is an Enterprise Architect and has served as a distinguished engineer at Cisco.
VuNet Systems is a deep tech AIOPs startup revolutionizing digital transactions. VuNet's platform vuSmartMaps™, is a next generation full stack deep observability product built using big data and ML models in innovative ways for monitoring and analytics of business journeys to provide superior customer experience. Monitoring more than 3 billion transactions per month, VuNet's platform is improving digital payment experience and accelerating digital transformation initiatives across BFSI, FinTechs, Payment Gateways and other verticals.