


Kris is a Site Reliability Engineer at a digital bank. Given the festive season, the Internet and Mobile Banking Platform is expected to see spike in transactions. He starts his day with a flurry of alerts via email and Slack, indicating the unstable state due to huge rush to cash in on the early morning offers by the e-commerce merchants.
Upon logging into the IBMB Observability Experience Center, Kris jumps in to view the Business lead indicators – there is latency in the transactions, error rates are increasing, and number of transactions are dipping. These are indications that there is something brewing in the IT systems. Kris detected the incident immediately.

Now, Kris needs to zero-in on the impact:
- Kris pulls up the micro-journey view to isolate the functions in IBMB application impacted. It is fund transfer!
- Now, Kris uses Segmented Views to further drill down on the channel and merchant.
- The real-time business analytics indicate transactions coming in through mobile channel from a major e-commerce partner are seeing a spike in time-outs.

Kris wants to now understand the reasons so that he can initiate the resolution. The Journey View / Service map indicates that the Core Banking System is in RED !

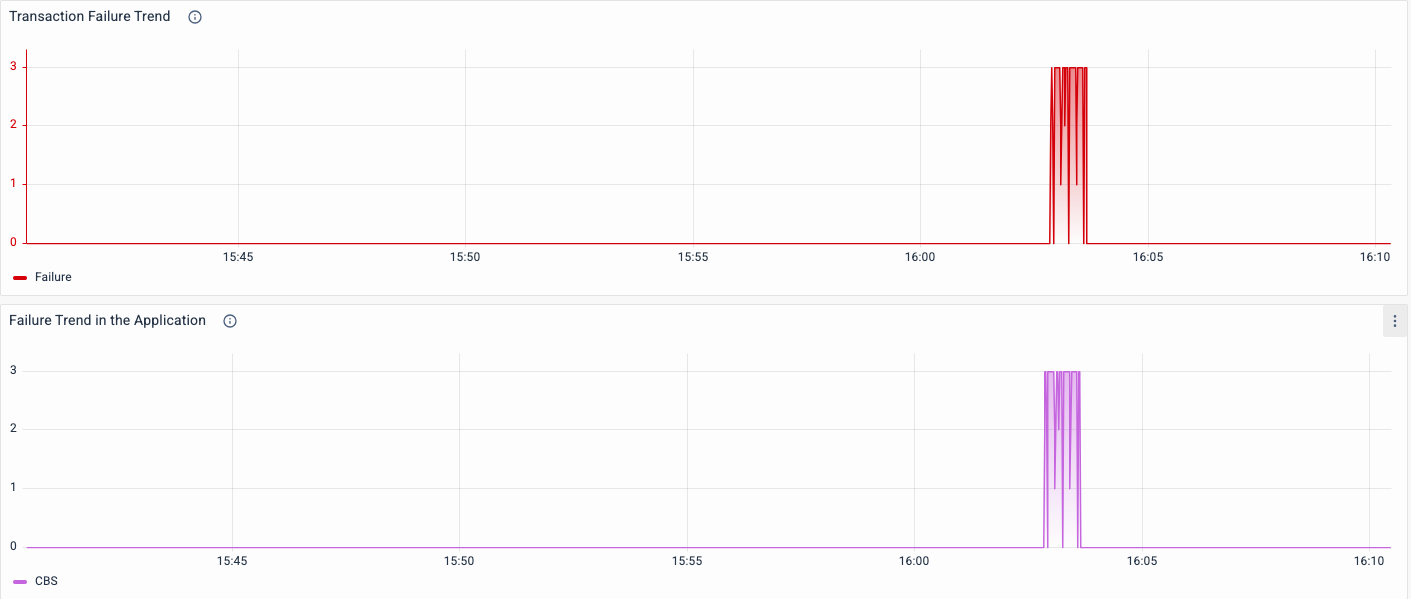
The timeseries charts validate and visualize the instances of the errors and behavior across the application. As expected, the transactions are failing at Core Banking System.
Now that Kris has immediately isolated the system, he is excited to drill-down and identify the cause of the failures.
Kris pulls up the impacted transactions to inspect deeper.

While log analysis reveals the errors causing latency and declines, trace analysis provides an overview of specific classes, methods, or functions at the code level.


Kris is quickly able to determine that it is the method – TransactionService.getAccountStatement that is failing in the Core Banking System.
He now calls-up the product team to help address the issue he troubleshooted so that the customer and business impact is minimal.
The Business-Centric Observability saved valuable hours – business lead indicators helped in quickly detecting the issue while journey-centric view with drill-down into log & trace helped in identifying the cause.
Now it’s your turn!
Log in to the IBMB Observability Experience Center and explore the platform. Utilize the instructional videos below for guidance on navigating the platform.
High TAT in IBMB due to slowness in CBS (Root Cause DB slowness)
Failure in IBMB due to failure in CBS
")

