How vuApp360 - our Application Observability platform uses OpenTelemetry to diagnose and address the root cause of issues in your application.

Introduction
In parts 1 and 2 of our OTel series, we introduced the OpenTelemetry standard, how it lends itself to the three pillars of Observability, and how VuNet leverages OTel to enable distributed tracing in your applications via instrumentation. Now, in this concluding segment of the series, we delve deeper into the pivotal role OTel assumes in diagnosing and resolving issues within your enterprise via Unified Observability. Through an illustrative example centered on a standard IBMB (Internet Banking, Mobile Banking) application, we explore the practical implications and benefits of leveraging OTel for effective issue resolution.
Navigating the Complexity of the IBMB Landscape
In today's digital age, the stakes are high for banks as they navigate the intricate landscape of Internet and mobile banking applications. With traditional branches seeing decreased foot traffic, the reliance on digital channels has surged, making uninterrupted service a critical priority.Amidst this transformation, Site Reliability Engineers (SREs) and IT Operations teams grapple with many challenges. From managing applications and APIs to handling third-party interconnects and infrastructure, the complexity of the banking ecosystem poses significant hurdles. The first indication of an issue in such systems often originates from end users reporting errors or slowness within the application. Operations teams often follow a manual and iterative process to identify and resolve application performance issues. Some of the problems with this approach are:1. Dependency on User Error Reporting leading to Reactive Resolution: Relying solely on end-user reports to detect issues means that problems may go unnoticed until they are reported. The reactive nature of resolution means that concerns are only addressed after they have impacted end users. This reactive stance increases downtime, user frustration, and potential business losses.2. High MTTR (Mean Time to Resolve): The manual process of investigating issues by sifting through siloed logs and metrics is time-consuming and resource-intensive. It requires significant effort from the operations team, leading to delays in issue resolution and increased operational overhead.3. Limited Context and Visibility: Siloed logs and metrics provide only partial visibility into the application stack. Without a holistic view of the system, it's challenging to understand the full context of issues and accurately identify their root causes. Correlating data from disparate sources, such as logs and metrics, can be difficult and error-prone. Integrated tools or frameworks facilitate correlation, and help identify relationships between different components.4. Scalability Challenges: As applications and infrastructures scale, managing and analyzing siloed logs and metrics becomes increasingly complex. Traditional approaches may struggle to scale effectively to meet the demands of modern, distributed environments.The need of the hour is for a groundbreaking observability solution designed to place the internet banking customer experience at its core and offer real-time insights and data-driven decisions for SREs and IT operations teams. With such a tool, SREs can swiftly pinpoint the root cause of issues and resolve them proactively and with ease. From detecting performance drops to examining technical failures and increased latency, the platform can provide a comprehensive overview of each transaction handled by IBMB and its associated applications. Seamless collaboration across customer support, ITOps, DevOps, and business teams, would foster a unified approach to problem-solving. Armed with such a domain-centric observability solution, banks can ensure a seamless customer experience while staying ahead in the rapidly evolving digital landscape.In the next section, we examine how vuApp360™ offers such a solution with the help of OpenTelemetry and comprehensive instrumentation, to enable distributed tracing, quicker RCA (Root Cause Analysis), and targeted problem-solving in IBMB applications.
A Day in the Life of an ITOps Specialist for IBMB
In the fast-paced world of IT Operations (ITOps), every day brings new challenges and opportunities for problem-solving. Sandy is a seasoned ITOps Specialist at a leading financial institution, tasked with ensuring the smooth operation of their Internet Banking and Mobile Banking (IBMB) application, the lifeblood of their customers' financial interactions.One fateful morning, during a festive sale, Sandy's keen eye catches a sudden surge in latency and error rates flooding the system dashboard. With each passing moment, the frustration among the customers is growing, and Sandy can sense the storm brewing on social media.In this critical situation, Sandy’s first instinct is to gather as much data as possible to understand the root cause of the issue and its impact on the business. He is confronted with three questions to be answered as quickly as possible:
- Can we zero in on which application has failed?
- Can we determine which components are involved?
- Can we isolate the failed transactions and deep dive into the root of the problem?
In this blog, we explore Sandy's approach to addressing these questions in three phases. In Phase 1, Sandy is armed with Traces using OpenTelemetry; in Phase 2, Sandy combines Traces from OpenTelemetry with logs; and in Phase 3, Sandy combines Traces, (OpenTelemetry) Logs and Metrics to perform root cause analysis and fixes the underlying issue with minimal disruption to user transactions.
Phase 1 - RCA with Traces using OpenTelemetry
vuApp360™ provides client instrumentation packages depending on the platform of the target application. When the package is deployed within the IBMB application, it starts emitting traces, using which Sandy’s team gets the following information:
1. Overall system performance metrics on a unified dashboard
Typically, issues within the applications are manifested in the form of a dip in the Request Rate, an increase in the Error Rate, or a rise in the Duration of fulfilling a request. The application’s performance KPIs can be calculated from the traces and provide the operations team visibility into these golden signals of the application performance:
- Request Rate
- Error Rate
- Duration
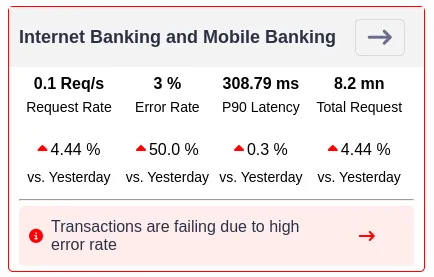
Sandy observes that there is a 3% error rate in the application. The trend of the RED metrics helps him identify anomalous patterns in the application performance.
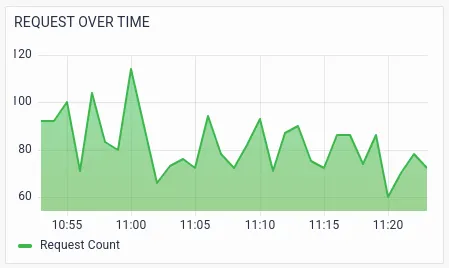
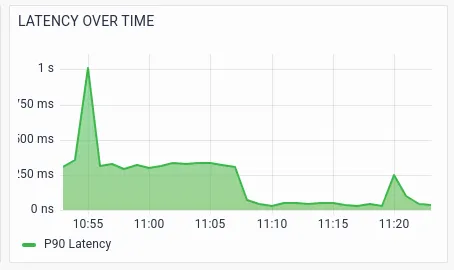
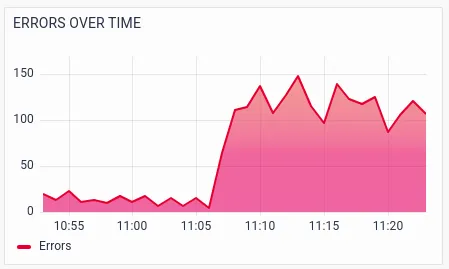

RED metrics with various segmentations/drill-downs help the operations team to further analyze potential issues. The below visualizations show the RED metrics by services, which helps Sandy identify the exact service that is causing the failures or slowness.
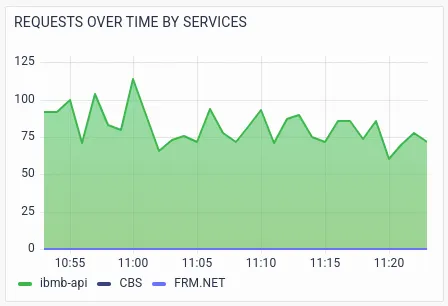
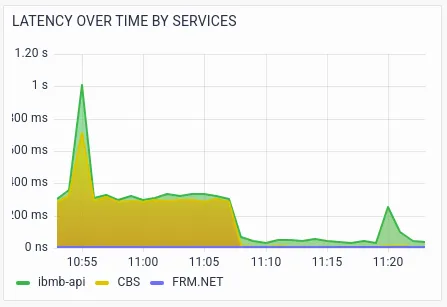
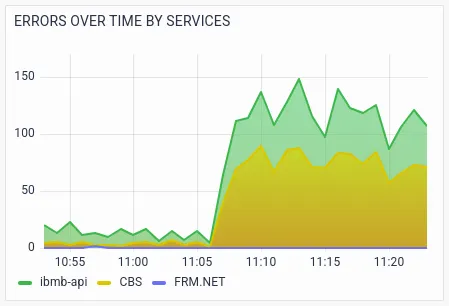

Sandy notices the spike in latency and errors in the ibmb-api service and CBS (Core Banking) service.Further visualizations drill-down RED metrics by transactions.

There are a large number of failures in the API call POST /ibmb/accounts/{accountNumber}/ fundtransfer.Drilldowns on RED metrics by host help the ITOps team to identify whether a particular host is causing problems.

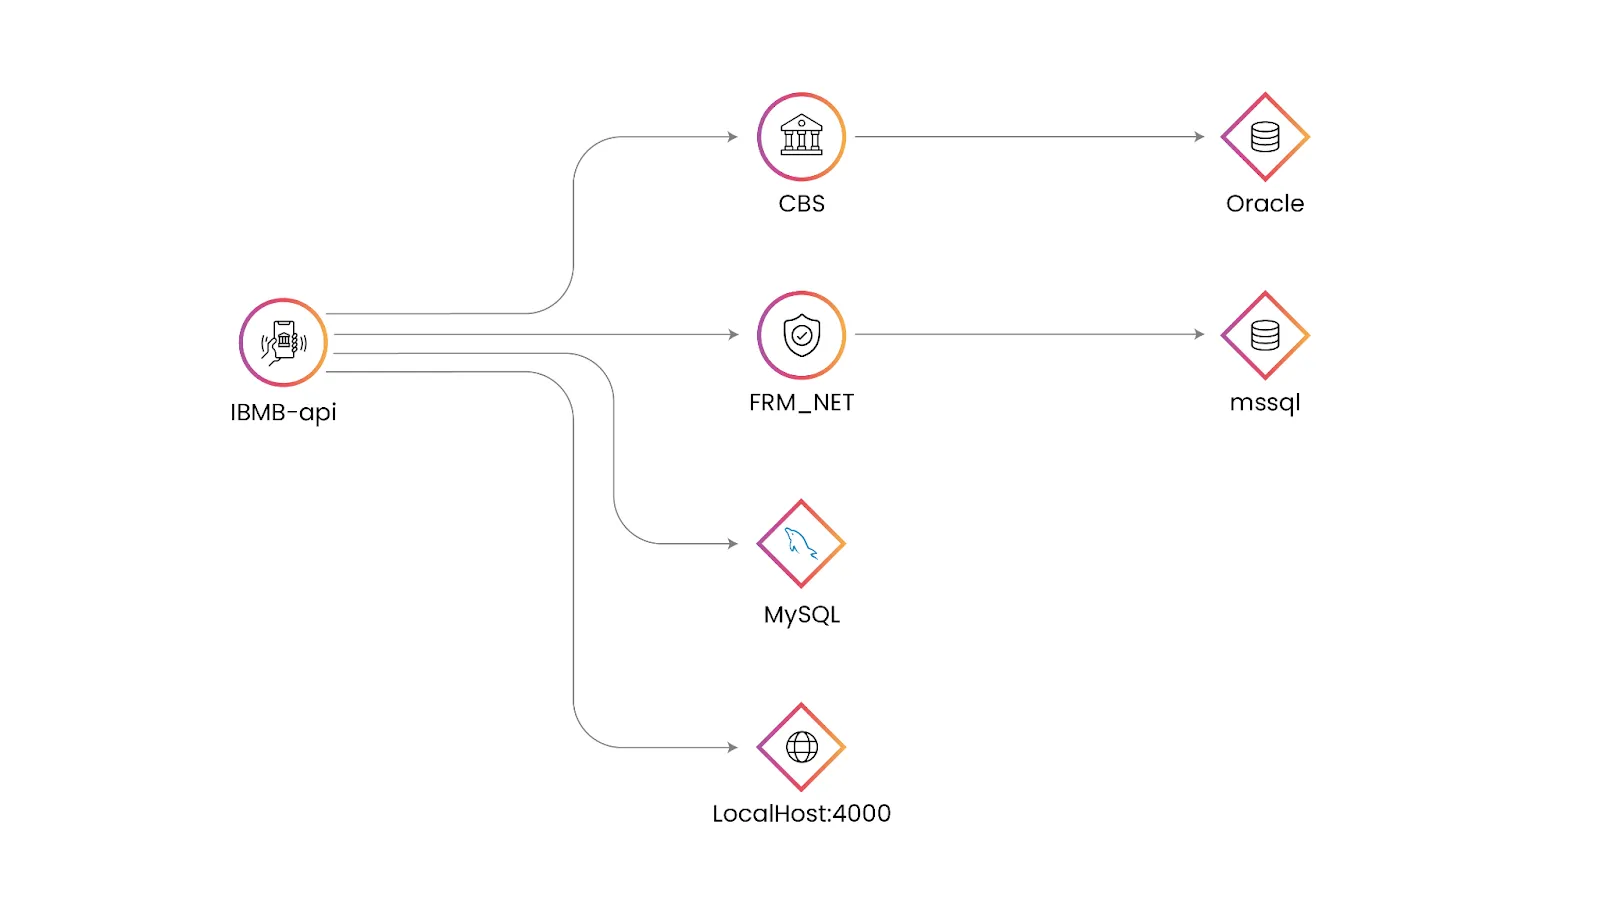
2. Application Topology Map which gives the context of transaction touchpoints and paths
vuApp360™ automatically plots the application topology map, visualizing application flow and customer journey paths, enhancing overall system understanding. This provides the Ops team visibility into the components that are communicating with each other to fulfill a user transaction and a clear picture of which component is contributing to the overall performance issues. This enables Sandy’s team to zero in on the problematic touchpoint quickly, thereby reducing MTTR.
Failed TracesThe Failed Traces table shows that the “Fund Transfer” transaction has significantly contributed to failures.

The detailed drill-down of one of the failed traces shows which transaction leg is failing.

The dashboard illustrates that the transferFund method in the AccountController class has failed, which causes the API call from the IBMB application to the CBS service (POST /cbs/api/v1.0/ accounts/fundtransfer) to fail.The stacktrace for the same is also available, which reveals there was a network issue while connecting to the Oracle DB.
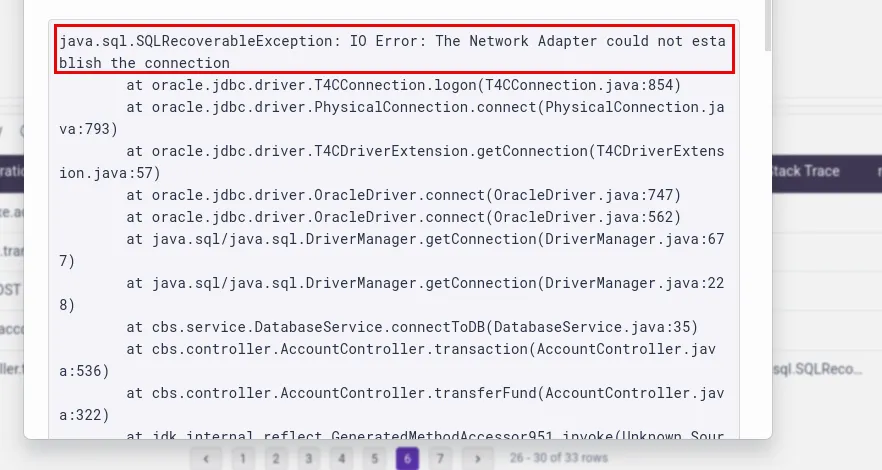
How traces help Sandy in debugging the issue:
- OTel provides a standard way of capturing traces.
- Traces help identify the indicative performance KPIs (RED metrics) quickly. Abnormalities in the RED metrics can be used to alert the operations team proactively.
- Traces help zero in on the service causing the issue, the affected transaction, and hosts where the issues are occurring.
- Traces quickly identify the affected API calls, as well as the operation causing the failure.
What is not possible with traces:
- Business context is not available with traces. It is difficult to capture the request payload which contains the business context.
- Success/failure is identified based on the HTTP request code. A code 2xx means success and 4xx/5xx means failure. Sometimes, the application developers return HTTP 200 responses for the failed transaction and the response body contains the actual error code. Since the response body is not available as part of the traces, Sandy cannot get the current status or reason behind the failure of transactions.
- OpenTelemetry cannot stitch together asynchronous transactions, i.e., the transactions in which a request and response arrive out of sequence. In today’s multi-API world, request-response mechanisms are nearly always designed to be asynchronous, and the tracing-only approach fails to capture them accurately.
These shortcomings can be addressed by the addition of logging on top of the OpenTelemetry traces, which leads Sandy to Step 2.
Phase 2 - RCA with Traces using OpenTelemetry + Logs
Sandy proceeds to Step 2, an improvement on the previous method, by incorporating logs into the traces to procure more information on the transactions, including error details and business context. Using OpenTelemetry, vuApp360™ can add a traceId into the log message by modifying the logging configuration. This feature enables directly linking the traces and associated logs. Traces and logs together are powerful for 360-degree observability and address numerous issues explained in the previous step.The logs in the IBMB application provide the following transaction-level drill-downs:
- Statistics by financial or non-financial transaction


- Statistics by the beneficiary bank


- Statistics by Transaction Type

- Response time statistics by transaction type

- Statistics by Response Category, with transaction declines categorized based on Business or Technical Declines, a parameter imperative to monitor given the high degree of regulatory scrutiny in the banking domain
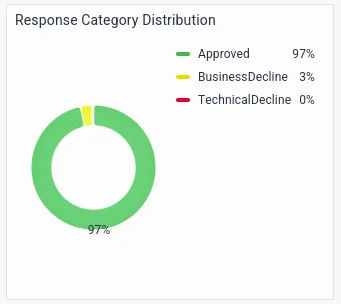
- Top journeys
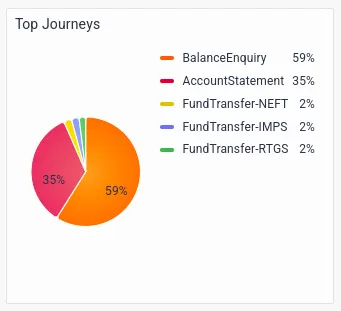
- Response Time by service, which helps identify slow and problematic services.

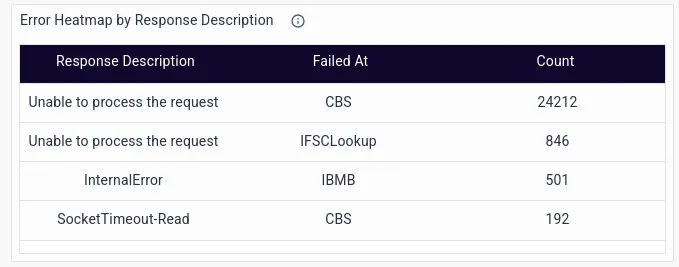
- Failures by Response Description, which go beyond a mere HTTP response code, and delve into the exact IT or business error message.
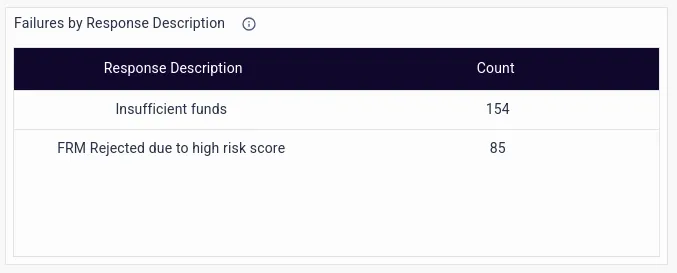
- Details on Business Declines, which are needed for regulatory audits.

- Technical Declines by Response Descriptions
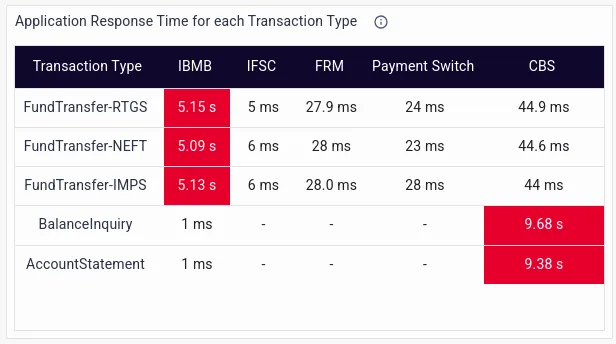
- Application response time for each transaction type, which helps flag transactions with high latency and error rates, allowing proactive resolution measures to be put in place before customer complaints start pouring in.
- Additional business context includes details like a RequestUUID, RRN, the transaction result, response category, response description, error code, customer ID, etc.

How logs help:
- Capture the business context of a transaction which is essential for operations teams to understand the impact of system downtime, transaction slowness, or IT issues on customer experience and ultimately, business outcomes.
- Can correlate traces to capture the fine-grained details of transactions that are impossible with just traces.
- Enable the stitching of the traces of asynchronous transactions using application-specific data like a RequestUUID.
- Enable identification and differentiation of Business and Technical Declines.
Phase 3 - RCA with Traces using OpenTelemetry + Logs + Metrics
The final piece of the puzzle for Sandy to successfully resolve the issue is identifying the root cause of the failure, which is where the 3rd pillar of Observability i.e. infrastructure metrics plays a vital role.Traces and logs can be correlated with the metrics using the following:
- Metadata like hostname, IP address, Docker container ID, etc. This metadata is captured by the traces automatically.
- Event time.
The stack traces earlier captured by traces in Phase 1 had revealed connection errors in the Oracle DB.
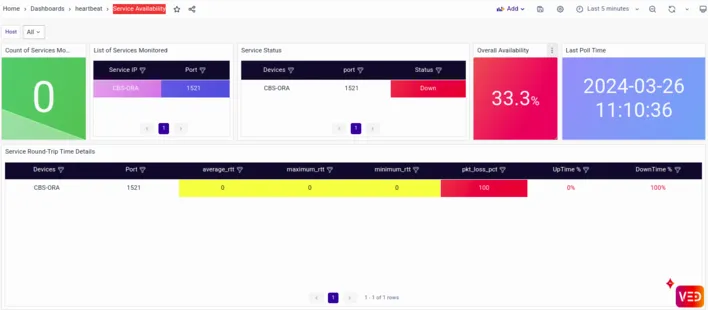

The dashboard reveals an availability issue on the same Oracle DB server. Upon closer inspection, Sandy identifies a bottleneck in the database queries executed by the CBS microservice. The sudden increase in transaction volume has overwhelmed the database, creating an availability issue and leading to slower response times and increased errors.With the root cause identified, Sandy swiftly mobilizes a response team to address the issue. They optimize the database queries, fine-tune the resource allocation, and scale up the infrastructure to handle the increased load more efficiently. They then restart the database, and as the optimizations take effect, the latency begins to decrease, and the error rates stabilize. The customers notice the improvement almost immediately, and the storm of complaints on social media subsides.In the aftermath of the crisis, Sandy conducts a thorough post-mortem analysis to learn from the incident and implement preventive measures to avoid similar issues in the future. Armed with the knowledge gained from this experience, his team emerges stronger and more resilient, ready to tackle any challenges that may come their way in the dynamic world of banking technology.
Conclusion
OpenTelemetry-based traces, when complemented by logs and metrics, can prove to be an invaluable tool in the hands of skilled operations teams in this fast-paced, customer-experience-oriented world. vuApp360™ can be a trusted partner in this transition, arming teams with just the right dashboards, drill-downs, and data that can help them win the war against technical and business errors that plague modern applications. By leveraging OpenTelemetry's standardized approach to tracing, coupled with vuApp360™'s intuitive interface and powerful analytics capabilities, IT Operations teams gain unprecedented visibility into the intricate workings of their complex applications.Moreover, OpenTelemetry's flexibility allows customization to suit specific use cases and environments. Whether it's a microservices architecture, a cloud-native application, or a hybrid deployment, OpenTelemetry can adapt to capture relevant traces and provide insights tailored to the organization's needs.In a competitive landscape, where customer experience is critical, and regulatory scrutiny in most domains is high, the ability to swiftly diagnose and address technical and business errors is crucial. With OpenTelemetry and vuApp360™, ITOps teams have the tools they need to stay ahead of the curve, ensuring optimal performance, reliability, and user satisfaction in even the most complex applications. You can now take a free trial of vuApp360™and to monitor up to 5 standalone Java applications for 30 days.


