

A look at the Machine Learning models that make VuNet’s RCA Assistant tick

Our AIOps series focuses on how VuNet’s flagship product, vuSmartMaps™, provides the platform for a rich set of ML models to be built upon it, and enables enterprises to graduate to complete automation.
In the second blog of the series, we examine how vuSmartMaps™ provides the data architecture on which VuNet’s AI/ML infrastructure, vuCoreMLOps is built. vuCoreMLOps’ pre-built ML models for anomaly detection and domain intelligence for event correlation make RCA faster, explainable, and more accurate.
Within 2 months of buying a new car, Sara started facing issues. At times the car would not start, or the engine would stall or lag/surge in the middle of driving. Out of the blue, the dashboard would black out and she would have to pull over and restart the engine for it to come back on. After countless visits to umpteen mechanics, wherein every single aspect of the car, including the carburetor, fuel injector, electrical wiring and the indicator light for dashboard warnings was checked and rechecked, the root cause was finally attributed to a faulty ECU (Engine Control Unit), by a mechanic with more than 20 years’ experience. The ECU had to be replaced, and after that, Sara’s car was good as new!
A modern car is a complex machine. An article by IEEE indicates that a premium-class automobile “contains close to 100 million lines of software code.” The software executes on 70 to 100 microprocessor-based ECUs networked throughout the body of the car. These computing units control engine functions, regulate braking behaviour and monitor the air conditioning system. To put this in perspective, a Boeing 787 Dreamliner only has 14 million lines of code! It was obvious that diagnosing the origin of the issue and narrowing it down to the ECU was something only someone well-versed in the inner workings of the car could do.
The point of Sara’s story was to drive home (pun intended!) the fact that problems do invariably occur, and when they do, the only way they can be solved is IF the root cause of the issue is detected accurately and in a timely manner.
We see something similar in software systems every day. Digital-first enterprises have complex and heterogeneous deployment environments, distributed across a hybrid software stack, with a single transaction traversing multiple touchpoints, internal as well as external APIs and microservices. In such a situation, when things go wrong, IT Operations Management (ITOM) and Site Reliability Engineering (SRE) teams are hard-pressed to answer two important questions:
- How do we know when something has gone wrong? In ITOM parlance - How do we reduce MTTD – Mean Time to Detect an issue?
- How can we get to the root cause of an issue so we can resolve it, i.e., how can we minimize MTTR – Mean Time to Resolve?
Peeking Under the Hood of vuRCABot 2.0
In our previous blog, “We Have a Bot for That”, we went over how vuRCABot 2.0, VuNet’s AI/ML-powered automatic RCA (Root Cause Analysis) assistant, reduces both MTTD and MTTR.
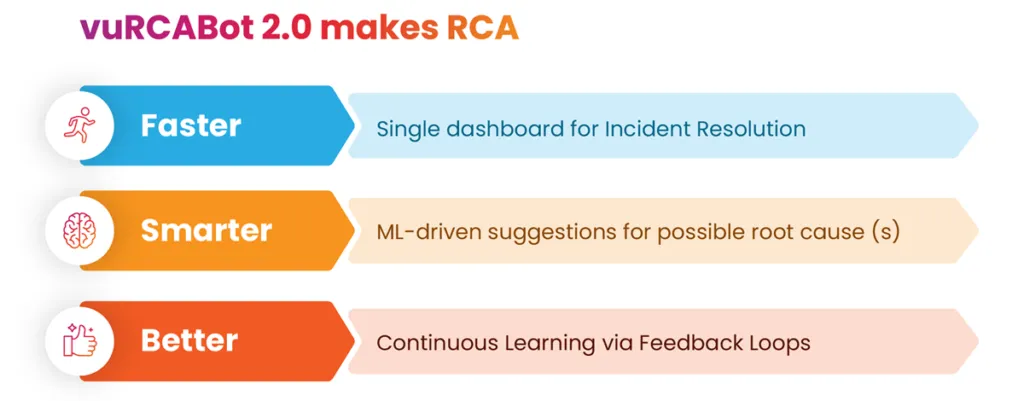
Fig: Benefits of using vuRCABot 2.0
Some of the use cases that vuRCABot supports include:
- Identifying issues based on anomalies – vuRCABot uses techniques to accurately detect an issue based on anomalous behaviour patterns detected in logs, metrics and traces, as well as anomalous lead indicators on business journey metrics. It helps do away with alerts raised on static thresholds and introduces much-needed domain context into issue identification and triage.
- Predicting and preventing instead of reacting – Unlike conventional monitoring systems which are manually run and reactive in nature, vuRCABot uses anomalies on infra metrics and lead indicators on journey metrics to envision future incidents before operations get interrupted, thereby preventing critical outages, and reducing downtime and maintenance costs.
- Correlating events to eliminate noise - vuRCABot delivers event correlation capabilities via patented techniques (which we will explore further in this blog), that reduce alert storms and automatically triage an incident, thereby enabling quicker resolution.
- Enabling root-cause analysis - Machine learning models are applied to the required journeys, components and underlying touch points. Early warnings and incidents are detected by vuRCABot to identify the root cause of the underlying issue, and trigger the appropriate recommended actions to fix issues.
- Ongoing improvement - Iterating with user and domain feedback loops, vuRCABot’s underlying ML models are progressively fine-tuned. This means its accuracy on root cause identification and corrective action recommendations keeps getting better over time. In essence, vuRCABot combines the ground truth of a human with the precision of a machine.
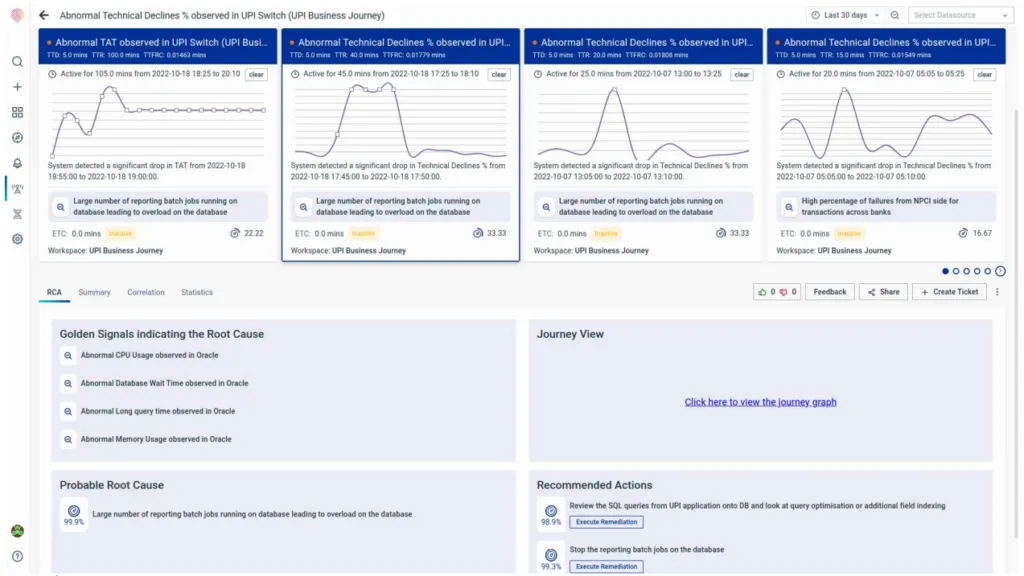
Fig: The Incident Resolution Screen, vuRCABot’s single pane-of-glass for RCA
We explore the engine which powers vuRCABot 2.0 and delivers these capabilities in the next section.
vuCoreMLOps – The Brain Behind vuRCABot 2.0
The ML team at VuNet , which houses PhDs and some of the best brains in statistical modeling and ML Engineering, has been working in deep collaboration with top-notch professors from premier educational institutions, as well as industry leaders with years of experience in AI implementations across various domains. Acting as our technology, strategic and ML advisors, they have guided us on the challenges to be overcome in terms of the data quality and integrity required to solve the problem at hand, the approaches needed and the nature of testing to be undertaken to fine-tune the algorithms to the extent that they work in production environments at scale.
In our blog entitled “Sowing the Seeds of MLOps in the Soil of vuSmartMaps™,” we spoke about VuNet’s vuCoreMLOps product, which is built on our Business Journey Observability platform vuSmartMaps’ information architecture. vuSmartMaps™ provides the necessary infrastructure for AI algorithms and ML models to be built upon it, as can be seen in the following diagram:
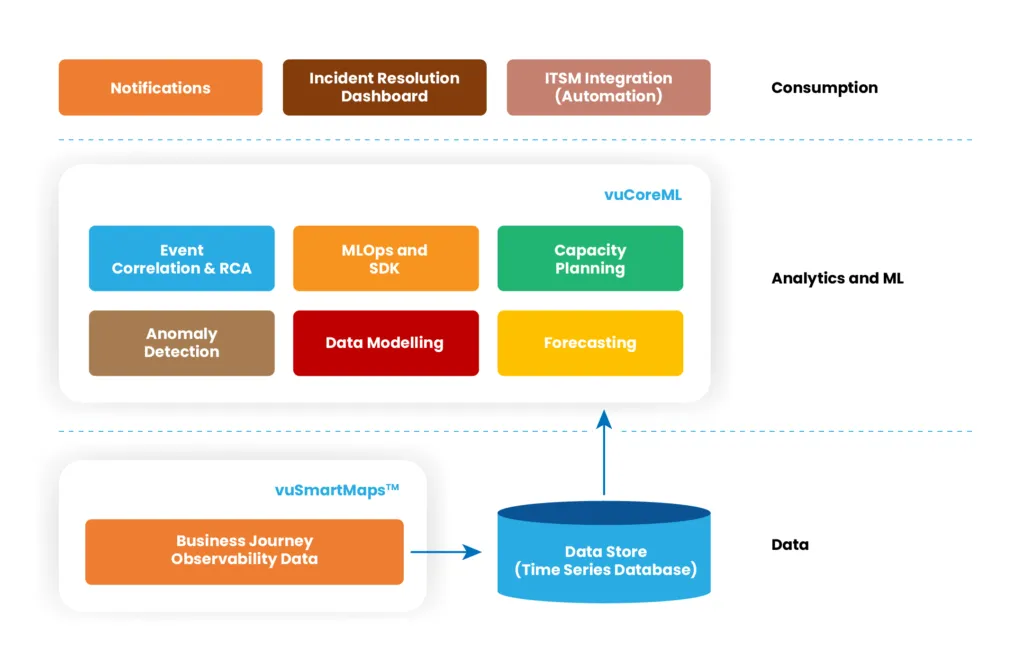
Fig: vuCoreMLOps has pre-built ML models for enabling AIOps in the enterprise
How vuRCABot 2.0 Works
A lot of what we have said so far might seem like it is too good to be true – an AI-powered assistant which delivers readymade RCA? But the fact remains that vuRCABot is one of the few tools today that is capable of event correlation, root cause analysis, automated remediation, and closure of feedback loops. What works in our favour is the fact that our correlations are based on journey metrics, which means that we use our expertise in Business Journey Observability and our proprietary vuSmartMaps™ platform as the foundation for the data that vuRCABot works with. Any AI/ML model is only as good as the data that is fed to it, and since our data is enriched and contextualized via a 5C process or “observability pipeline” detailed in an earlier blog, what we get is data tailormade for insights generated on journey metrics, and correlations made in the context of a user journey, instead of disjointed logs and metric data sets from disparate services and monitoring tools.
The essential inputs needed for effective RCA are a business journey observability view and historical data from failure events, known information on correlations between parts of the system, and a journey’s user experience lead indicators and golden signals, which give us essential information about the health of various components in the system. vuRCABot has an inbuilt MLOps layer, with the ability to store large volumes of metrics, logs, and traces data in the context of a journey at scale, to run pre-packaged and custom ML models.
The following flow diagram shows the methodology behind the magic – and why vuRCABot can do what it does, and do it well!

Fig: A bird’s eye view of vuRCABot 2.0 methodology and flow
1. The first step is to configure vuRCABot with the journeys that need to be monitored, that is, the main journeys to examine lead indicators for. vuRCABot not only allows users to configure data from vuSmartMaps™ but also allows data configuration from external data sources. It allows a simple configuration of data models, components, their relationship graph, lead indicators and golden signals. It learns the dependencies between the metrics and logs and constructs a topology map using the schema.
2. Next, the external indicators and operational telemetry are analyzed using our in-house advanced statistical technique to measure the health of a golden signal, called a CHI or Current Health Index model, and our domain-driven ensemble anomaly detection technique (online change point detection, clustering powered by dynamic anomaly masking), combined with automatic seasonality detection of signals. The outcome of this step is the identification of anomalies in lead indicators or golden signals (which are early warning indicators).
3. The next step is signal correlation for causality using statistical techniques. Our patented vu3T (time, topology and transaction ID) correlation and proprietary hierarchical topology filtering are performed to bubble up the problematic signals and components. These are displayed on the Incident Resolution Screen as the indicative Golden Signals across the entire stack.
4. After this, a neural network-based classification model and text summarization model use past incidents, root causes and domain feedback to fine-tune the underlying RCA algorithm, and produce the incident signature with probable root cause (summary of abnormal components with confidence of detection). This results in intelligent insights that provide the root cause of the issues in simple, user-friendly language along with the recommendations to fix the issue promptly.
5. vuRCABot also has an interface exposed for user feedback on incidents, and uses this data to summarize and suggest the next steps when incidents of a similar nature recur, helping in closing the feedback loop and building a knowledge base. In the immediate roadmap, integrations to ChatGPT are on the way to auto-summarize and provide easier-to-consume actionable insights.

Fig: vuRCABot is production-ready, flexible, intelligent and scalable
vuRCABot runs in near real time as a micro-batch job and handles thousands of signals to arrive at an RCA. In addition, it can handle a plethora of operational metrics, each with high cardinality. It also ingests data from vuSmartMaps™, existing monitoring tools, data stores and data lakes.
Initial tests in production environments, where vuRCABot was deployed alongside conventional monitoring tools, have thrown up some extremely encouraging results, with vuRCABot reducing MTTD and MTTR by as much as a whopping 75%! This is empirical evidence of the fact that the chosen approaches work.
Conclusion
With the proliferation of data sources to be monitored, the complexity and heterogeneity of deployment environments, the number of internal and external touchpoints a business journey traverses, and the need for enterprises to be up and running 24x7, conventional manual methods of performing root cause analysis must be replaced by AIOps. With its emphasis on tracking anomalies on business journey indicators to optimize user experience, and its unique approach to correlating signals to arrive at root cause recommendations, vuRCABot 2.0 is an enterprise’s best bet to perform this transition seamlessly. To know more about how vuRCABot 2.0 can transform RCA in your organization, contact info@vunetsystems.com.