

Our AIOps series focuses on how VuNet’s flagship product, vuSmartMaps™, provides the platform for a rich set of ML models to be built upon it, and enables enterprises to graduate to complete automation.
In the first blog of the series, we examine how enterprises can deal with Murphy’s Law in their IT Operations Management (ITOM), by employing techniques for effective root cause analysis (RCA). Our proprietary tool – vuRCABot 2.0 –makes RCA faster, explainable, and more accurate.

“Anything that can go wrong, will go wrong.”- Murphy’s law
It was 8 PM on a Friday evening, and the Network Operations Center (popularly called the War Room) in a large private bank was buzzing with activity. Twenty odd IT Operations personnel were huddled around a cluster of screens, sifting through service dashboards and frantically correlating alert data to determine the root cause of an issue which had started 2 hours prior. Social media was abuzz with a hashtag trend expressing user outrage that payments and Net banking transactions were failing, with some users failing to get an OTP to authenticate their transactions. Tempers were running high; the pressure was mounting and the clock was ticking. But one thing everyone in the room knew for certain – they were not going home that night until the issue was fixed.
At 2:15 AM, the issue was finally attributed to an erroneously triggered reporting batch job overloading the database, and resulting in abnormally long query execution and turnaround times between the critical payments application and database. The problem was fixed by force-stopping the reporting jobs running on the database – which needed the lead of the respective team to be awoken from his slumber – and all was well again.
Everyone in the troubleshooting team who went home that night had at least one of the following questions running through their minds:
- Could the system have given us a heads-up that there was something running in the database layer that should ideally not run at this time?
- Could the correlations between alerts across different services have been done automatically?
- Could we have been certain that we had got all the data we needed from all internal and external APIs and microservices in order to troubleshoot?
- Most importantly, could the issue have been prevented BEFORE user experience got adversely affected, and the negative hashtag trend swamped social media?
What ITOM Teams are facing today
The above incident is a norm in the life of an IT Operations Manager or Site Reliability Engineer. Digital-first enterprises have complex and heterogeneous deployment environments, distributed across a hybrid software stack, with a single transaction traversing multiple touchpoints, internal as well as external APIs and microservices. Added to that, the pressure of negative customer feedback on social media makes it impossible to think first and react later. In such a situation, when things go wrong, ITOM and Site Reliability Engineering (SRE) teams are hard-pressed to answer two important questions:
- How do we know when something has gone wrong? In ITOM parlance - How do we reduce MTTD – Mean Time to Detect an issue?
- How can we get to the root cause of an issue so we can resolve it, i.e., how can we minimize MTTR – Mean Time to Resolve?
MTTD and Anomaly Detection
MTTD depends on the volume of logs and metrics with alerts on them. Typically, IT Operations teams tackle issues by sifting through multiple dashboards, each dedicated to a data silo. Alerts flow in based on static thresholds on infrastructure and transaction level metrics. Examples of infrastructure metrics include CPU, Memory Usage, Active Threads, Query execution times etc., typically collected by intrusive agents. Transaction level metrics are collected from logs and used to track turnaround times (TATs), business and IT error codes, and response times. Alerts on these metrics, if any, give ITOM teams an idea of the state of the system.
Alerts do not necessarily mean that systems are in the red – static thresholds are not only subjective but also misleading. For instance, CPU utilization could have an upper threshold of 95% set on it, resulting in alerts for high CPU usage, but transactions could still be concluding successfully with no errors or slowness.
MTTR and Issue Resolution
The MTTR metric, on the other hand, depends on the number of alerts across services that ITOM teams can correlate by looking through log files and transaction traces, to arrive at possible root causes for an issue. These issues can originate either internally in the enterprise’s own infrastructure, or externally in one of the many microservices and APIs a transaction converses with. An added layer of complexity originates from the fact that errors could be business or technical in nature.
Not only does downtime result in revenue loss and customer churn, but MTTR requirements have also become more stringent in recent years, with regulatory authorities stating that enterprises will be held responsible for failures of transactions that are technical in nature. A penalty is also levied if TATs are above a certain threshold. This means that along with the need for MTTR to be reduced, the issue also needs to be remediated as soon as possible before transaction failures occur.
Some drawbacks of the existing approaches to issue detection and resolution include:
- Different teams spending considerable time engaged on the same problem.
- Bottlenecks in problem identification due to a high volume of data as well as multiple touchpoints (applications, components and servers) per user transaction.
- End-user responses adversely affected when business metrics are treated the same as IT metrics.
- Temporary fixes instead of permanent solutions, resulting in recurrence of issues.
- High cost of buying and maintaining disparate and incompatible tools.
- Experimenting with AIOps solutions with no clear outcomes.
- Lack of workforce with twin knowledge of AI/ML applications as well as domain experience.
A new paradigm for optimizing MTTD and MTTR is clearly the need of the hour.
Enter vuRCABot 2.0
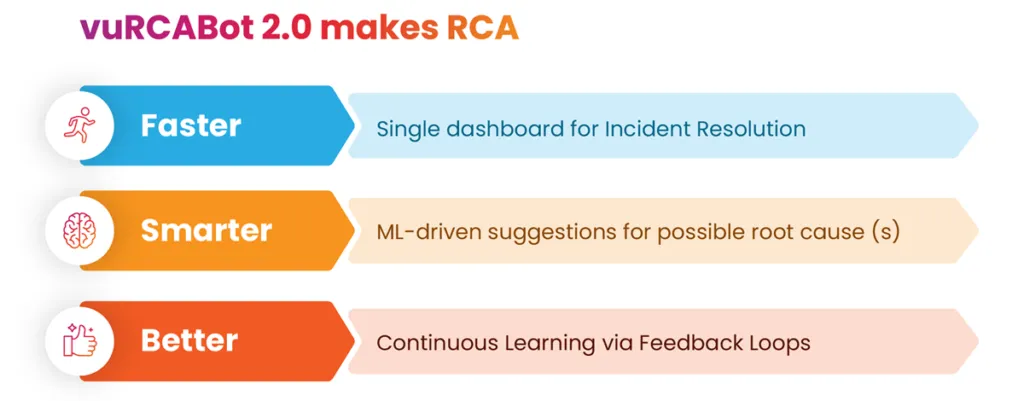
Fig: Benefits of using vuRCABot 2.0
In what way is vuRCABot 2.0 faster, smarter, better?
vuRCABot 2.0 helps address the most common challenges faced by ITOM teams in multi-party transaction environments with complex and heterogeneous deployment architectures and multiple monitoring tools. It correlates anomalies in the context of a BUSINESS JOURNEY and presents them using principles of Unified Observability on a single Incident Resolution dashboard, cutting across infrastructure, cloud, applications and transactions. Some ways in which it has helped achieve the objectives of predictive analytics and ML-driven incident triage are listed below:
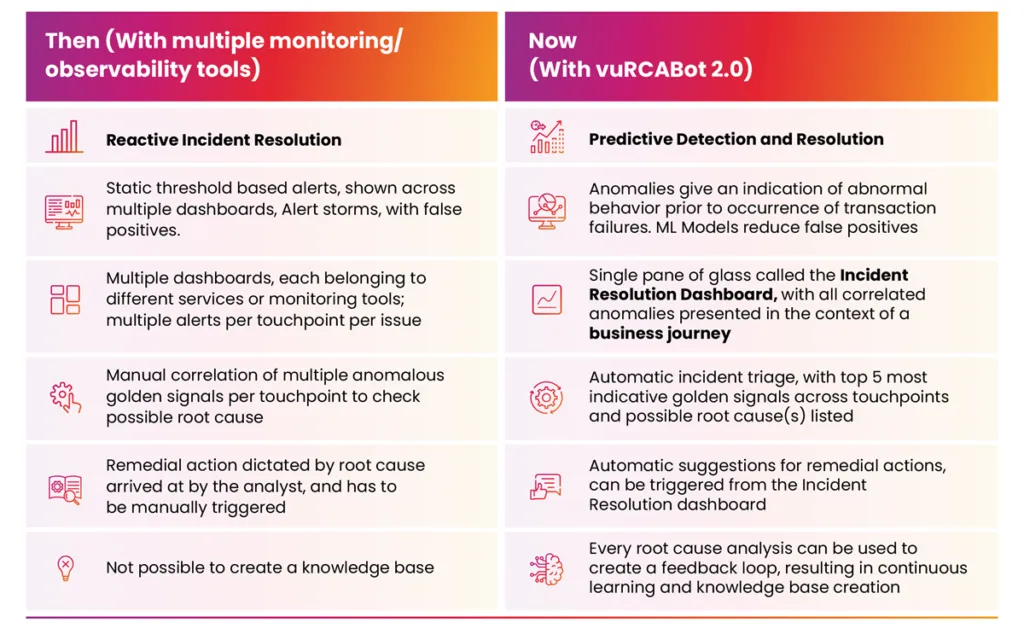
Fig: Then vs. Now
How does vuRCABot 2.0 fix the above issue?
vuRCABot 2.0 was tested in a similar customer environment on a similar issue, and here is how it performed:
1. Earlier, the troubleshooting team had to contend with multiple dashboards from multiple tools. vuRCABot, on the other hand, presented all relevant metrics, traces and golden signals in the context of a single user journey – a mobile first payment Business Journey, to be precise – on a unified Incident Resolution Dashboard.
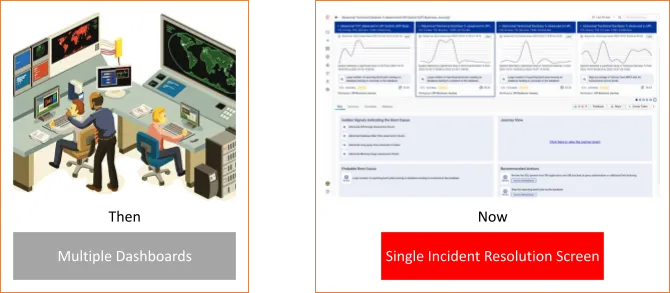
Fig: Then vs. now: Multiple dashboards across disparate silos, necessitating manual correlation, vs. Single Pane of Glass called Incident Resolution Dashboard
2. Previously, the team had to manually correlate golden signals across service/tool dashboards AFTER the transaction declines had already started. The vuRCABot, on the other hand, flagged anomalous behaviour in the transaction turnaround times (“Significant drop in TAT starting at 18:56”) and correlated it to an anomalous reporting batch job running on the database. This is an example of:
- MTTD getting reduced due to early warnings on the lead indicators of a business journey,
- The temporal correlation performed by vuRCABot in order to give L0 and L1 teams situational context along with all required correlations across the stack already in place. This eliminates the need for manual correlations of infrastructure and journey metrics.
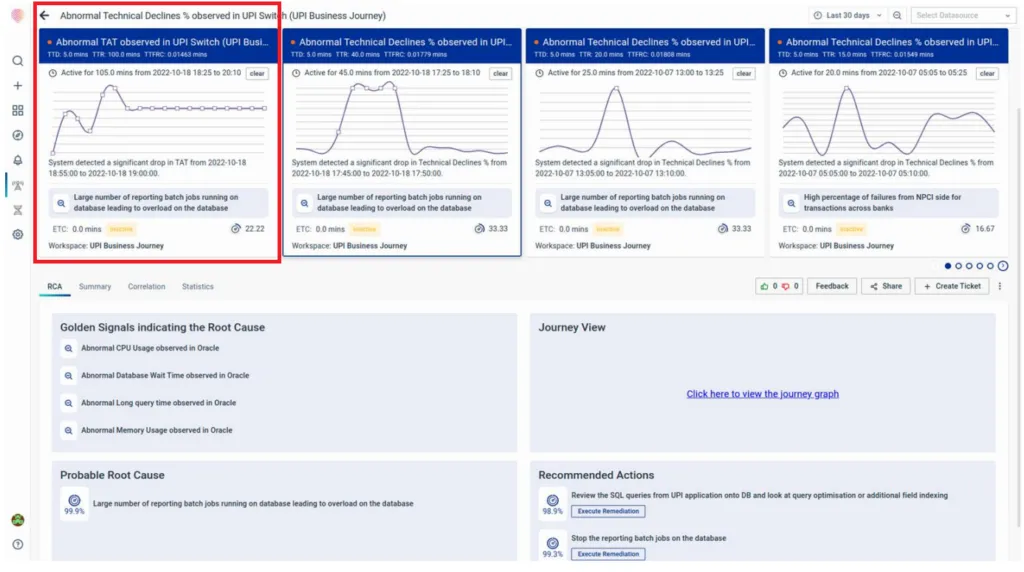
Fig: ML-driven correlation of anomalies, including business and technical errors, across services.
3. vuRCABot 2.0 uses a combination of deep learning and a hierarchical approach as per the application journey to capture the most likely root causes, thereby decreasing MTTR. In this case, indicative golden signals across services were grouped together. Consequently, the overload on the database due to the large number of batch jobs was flagged as the most probable root cause.
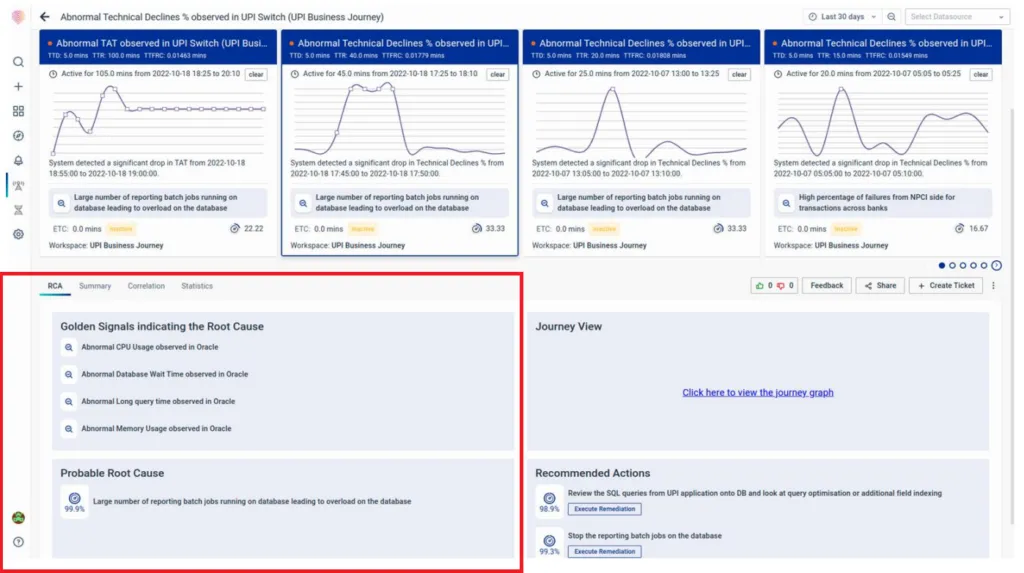
Fig: List of correlated Golden Signals and emergent root cause suggestions.
4. vuRCABot 2.0 prescribed healing actions that could be performed to mitigate the incident. Instead of just being passive messengers of information, the ITOM team could initiate remediation and stop the rogue reporting batch jobs through integrations with IT Automation solutions.
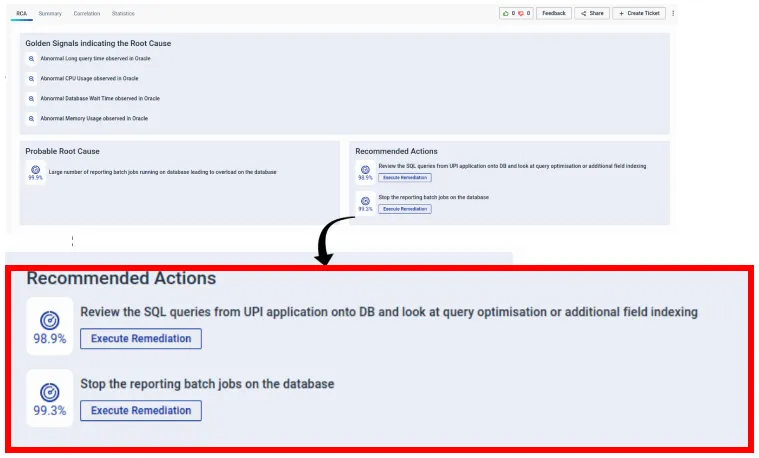
Fig: List of recommended remediation actions
5. vuRCABot allows collaboration between teams as well as closing of feedback loops via the user interface. For instance, in the above case, root cause suggestions can be ranked, which makes the algorithm either reinforce or relearn previously drawn hypotheses.
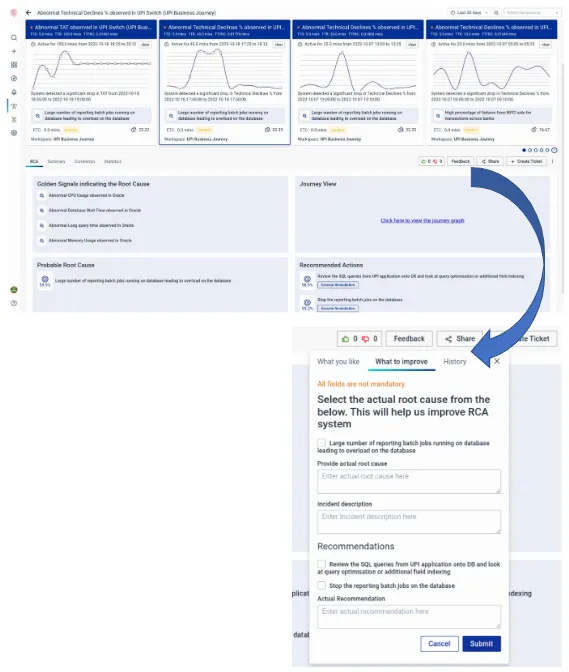
Fig: Closing the feedback loop and enabling the system to learn iteratively
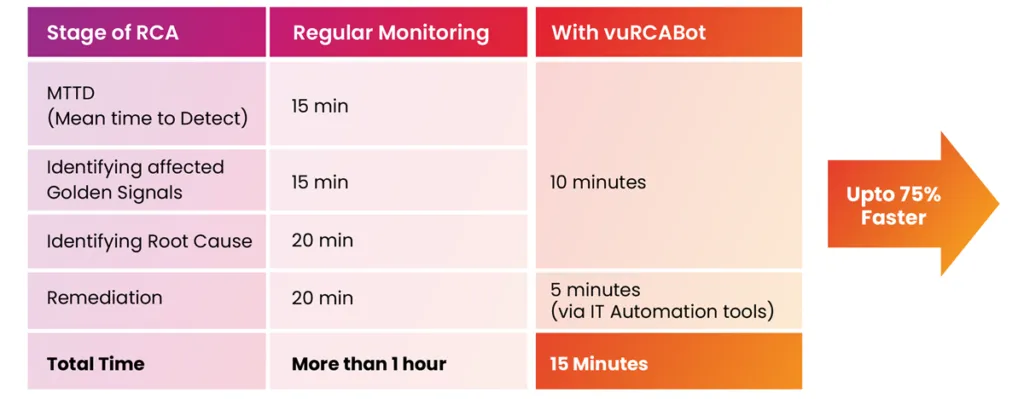
Results Obtained via vuRCABot 2.0 Deployment in Test Environments
vuRCABot performed significantly better than conventional RCA in the simulated lab environment mentioned in the above use case. The following table captures the time taken for each stage of the RCA using traditional monitoring and observability tools (for a typical issue) compared to the time taken for RCA using vuRCABot’s Incident Resolution Dashboard. Further, with incident feedback loops and a larger store of incident analysis, the modules learn over time and make the root cause analysis even faster, reducing the surface area of the unknowns unknowns.
Conclusion
vuRCABot 2.0 uses lead indicators on journey metrics and AI/ML approaches to correlate anomalies and reduce alert noise. This not only optimizes MTTD, but also provides a means to generate intelligent root cause recommendations that reduce the time for issue triage and resolution i.e MTTR, by up to 75% over conventional methods.
So how does vuRCABot do this? We will explore this and the ML Operating System layer of VuNet called vuCoreMLOps, which sits on top of vuSmartMaps ™ and gives you the necessary AI/ML infra and accelerators to automate your enterprise, in the next blog of the series – Under the Hood of vuRCABot 2.0 – What makes VuNet’s RCA Assistant tick.