

Modern applications are no longer static monolithic systems. They are complex, evolving ecosystems of microservices, APIs, and third-party integrations, each influencing the user experience.
And when something breaks? Traditional monitoring tools might show what broke, but rarely why it broke — or what it means for your users or business. But what you need is answers to the why, where, and how and that too instantly. That is where Embedded Observability comes in.
What is Embedded Observability?
Embedded Observability refers to the integration of observability features directly within the software application or platform itself. In a way, it is Observability-driven development. Powered by open standards like OpenTelemetry, it provides real-time, high-fidelity signals that reflect actual application behavior, performance and diagnostics in real-time.
Embedded Observability vs. Traditional Monitoring
With the rise of distributed systems and microservices, embedding observability is becoming essential for any product suite. Traditional monitoring simply can’t keep up with the complexity and here’s why.
Traditional monitoring is great at catching system-level failures; like a crashed database or a memory leak. But when a user journey breaks in intermittent ways, like a payment gateway timing out only for one region, or increased latency only for certain customers - traditional tools leave teams guessing.
Embedded observability, on the other hand, tells a complete story. Not only does it show that a transaction failed, it can tell you why, where, for whom, and what the impact was.
Why This Matters More Than Ever
As modern systems grow more distributed, dynamic, and user-centric, the chances of errors are more. Downtime, degraded performance, or failed transactions don’t just affect IT - they hit revenue, user trust, and regulatory compliance.
Embedded observability helps teams:
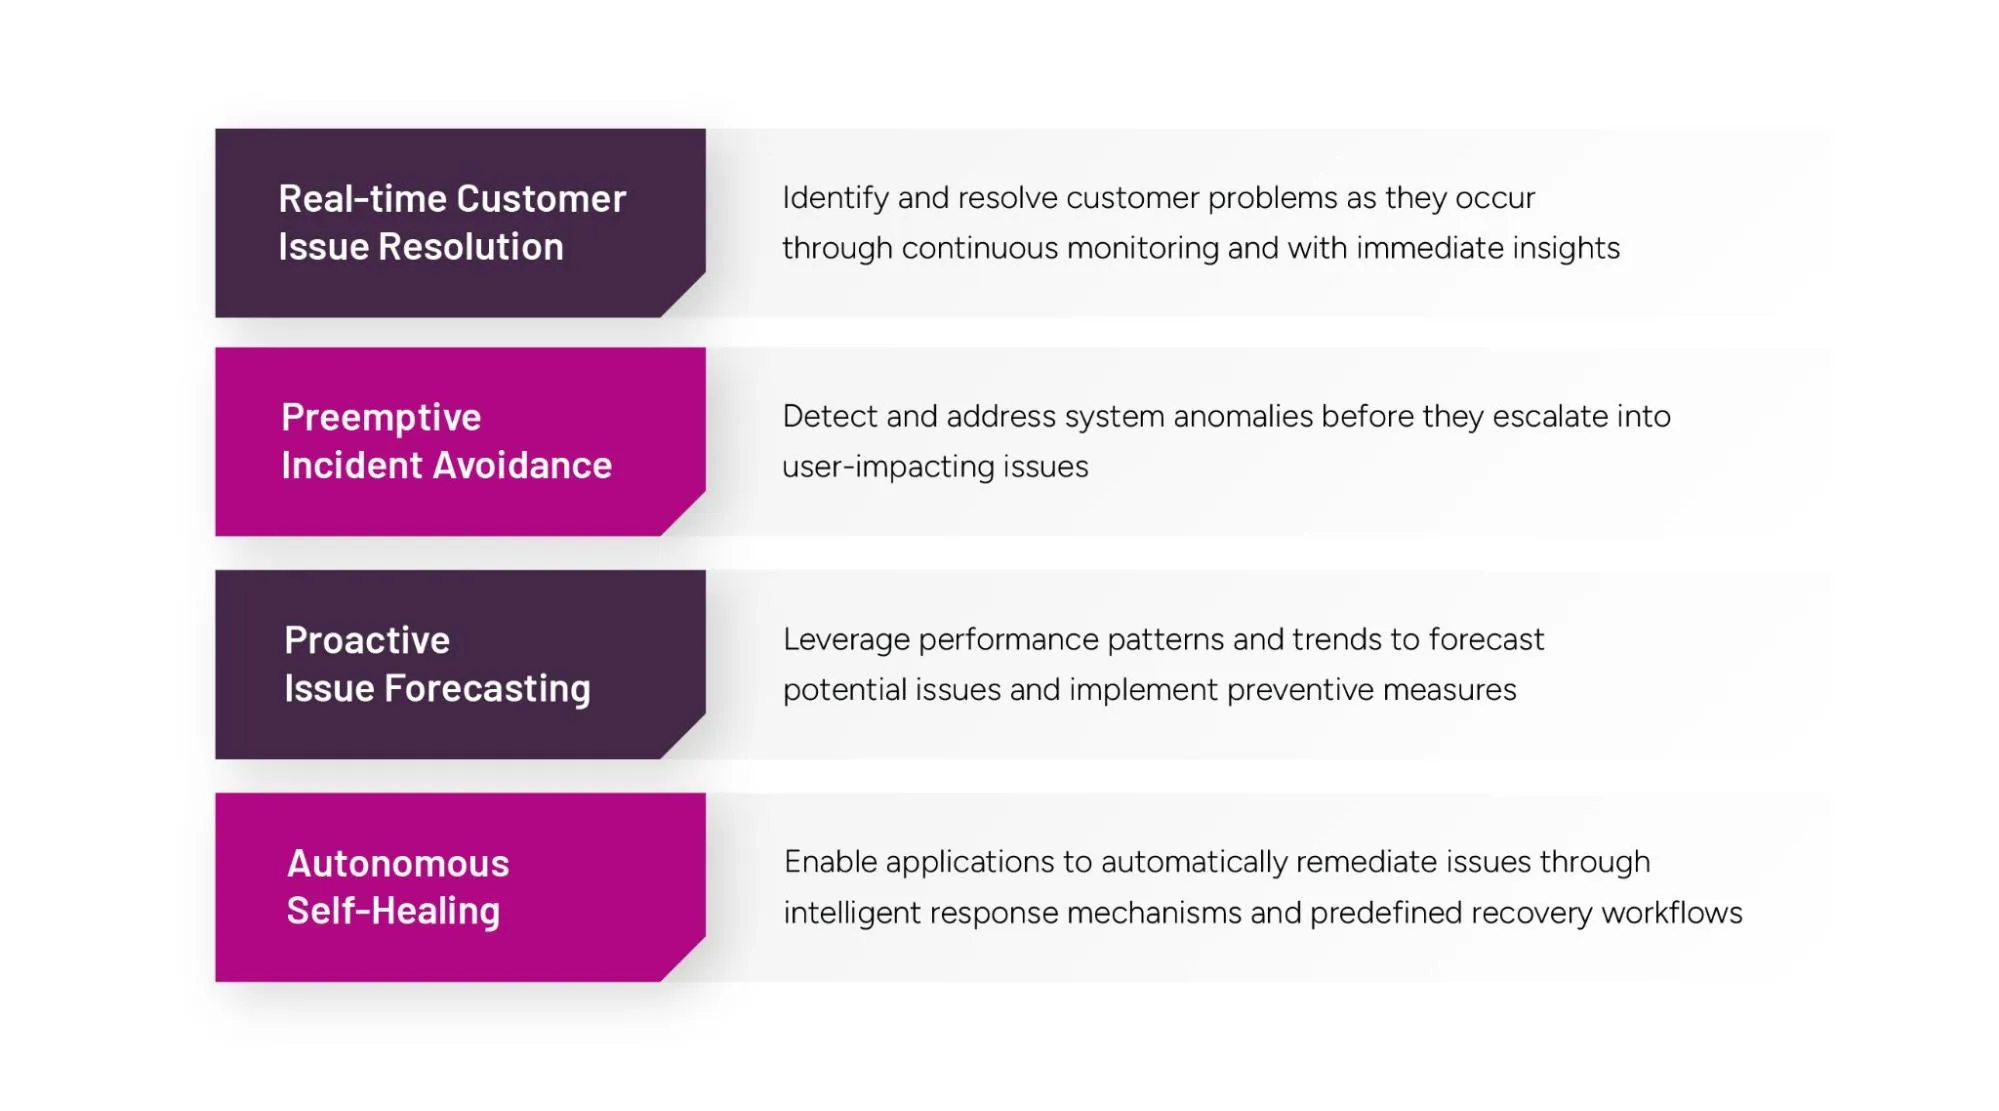
It transforms observability from a reactive troubleshooting tool into a proactive force for digital performance and reliability.
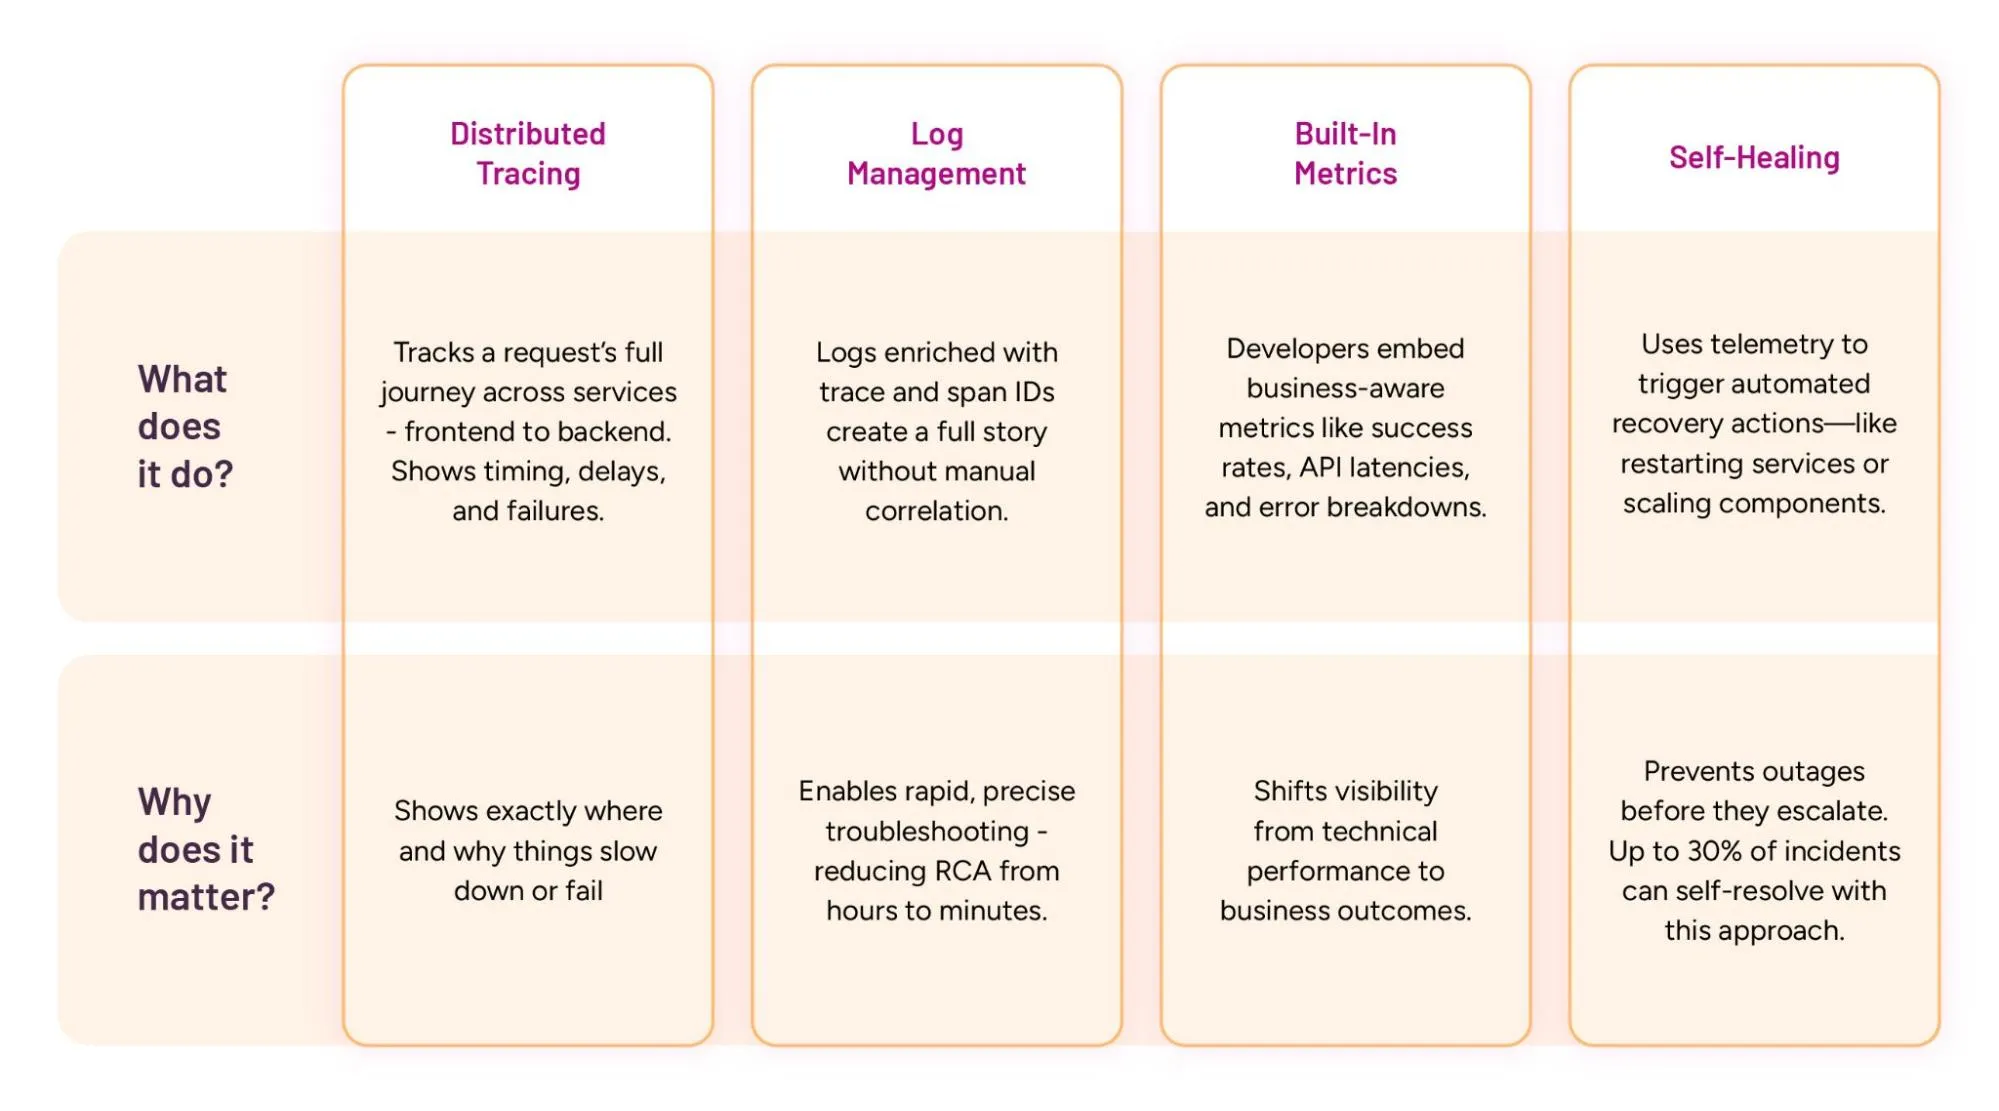
The Pillars of Embedded Observability
True embedded observability stands on four strong pillars:
Embedded Observability in Action
Let’s take a real-world scenario: a user trying to make a fund transfer.
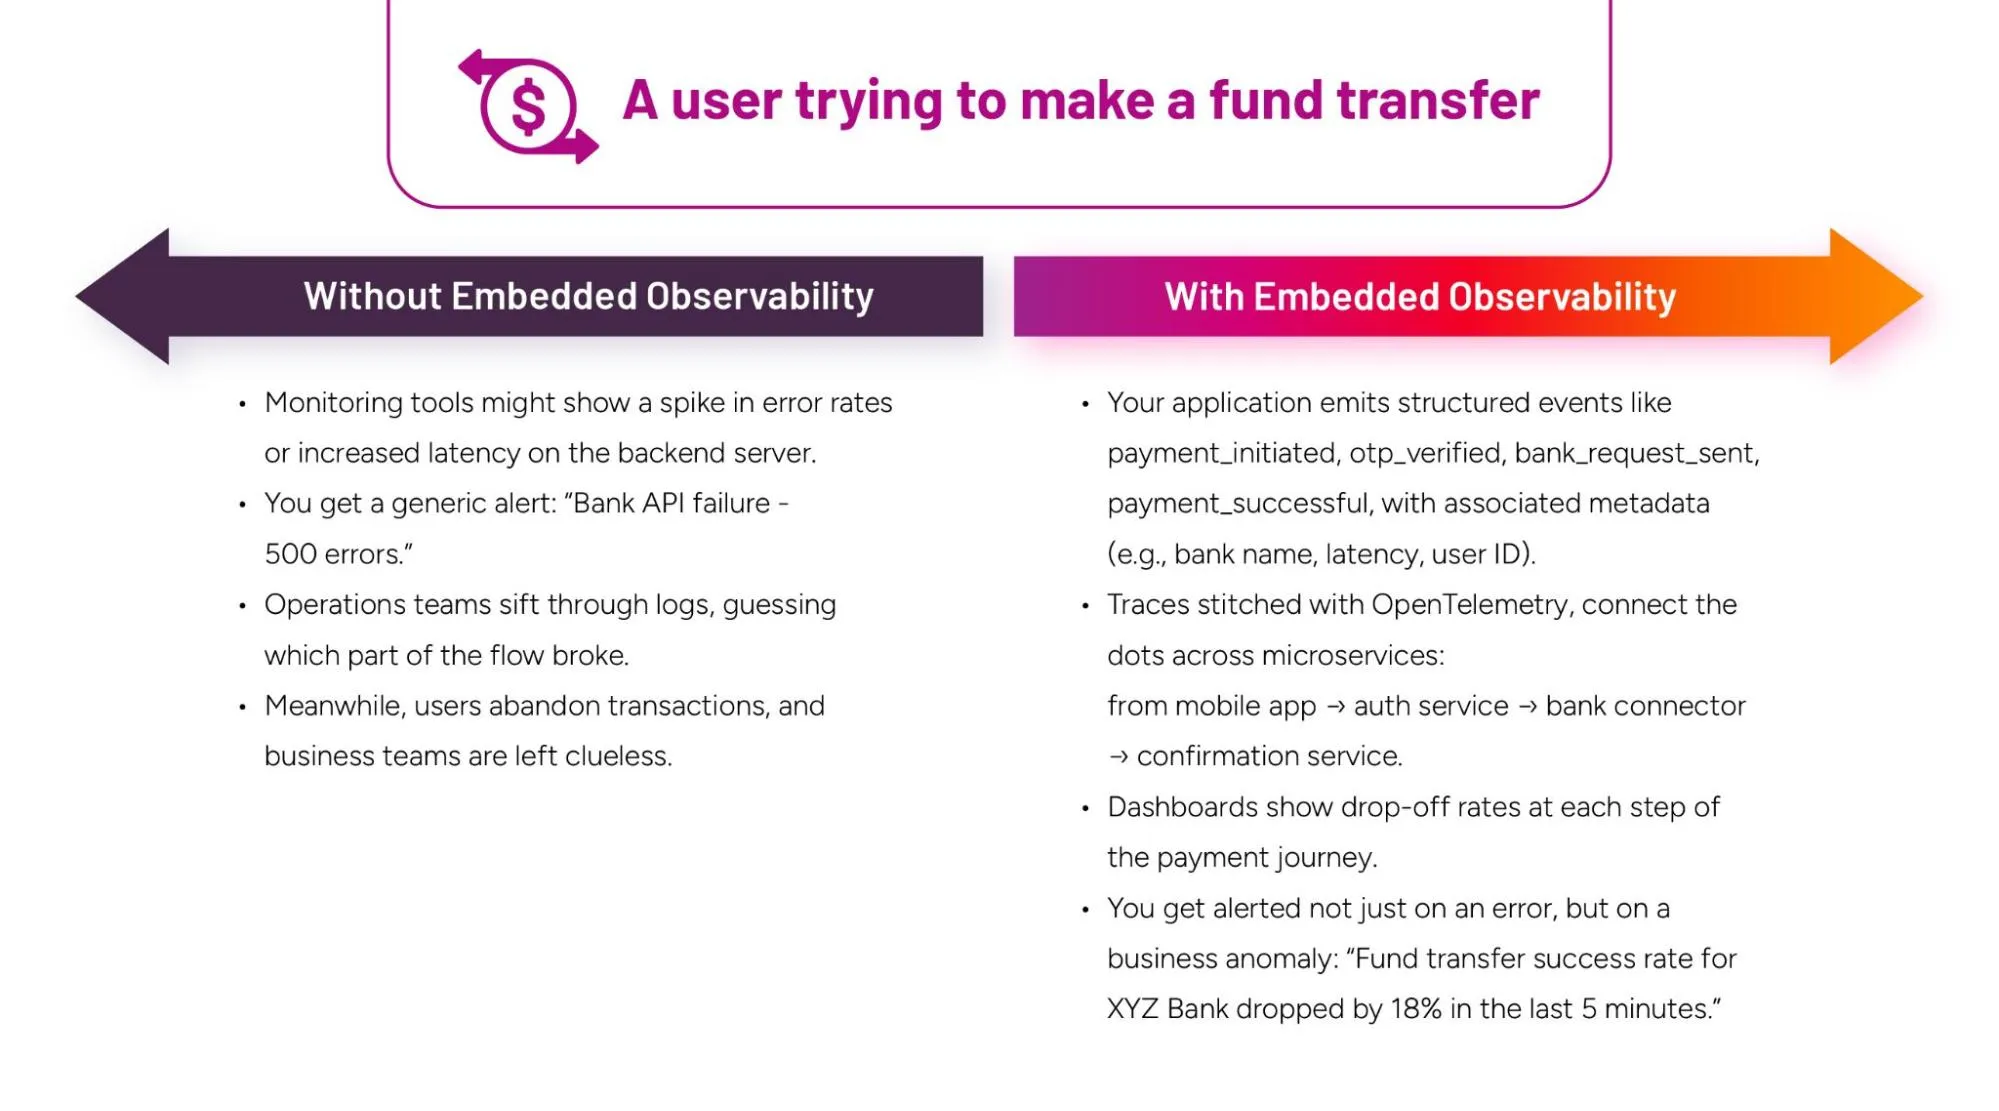
Suddenly, it’s not just monitoring—it’s insight, and it's actionable.
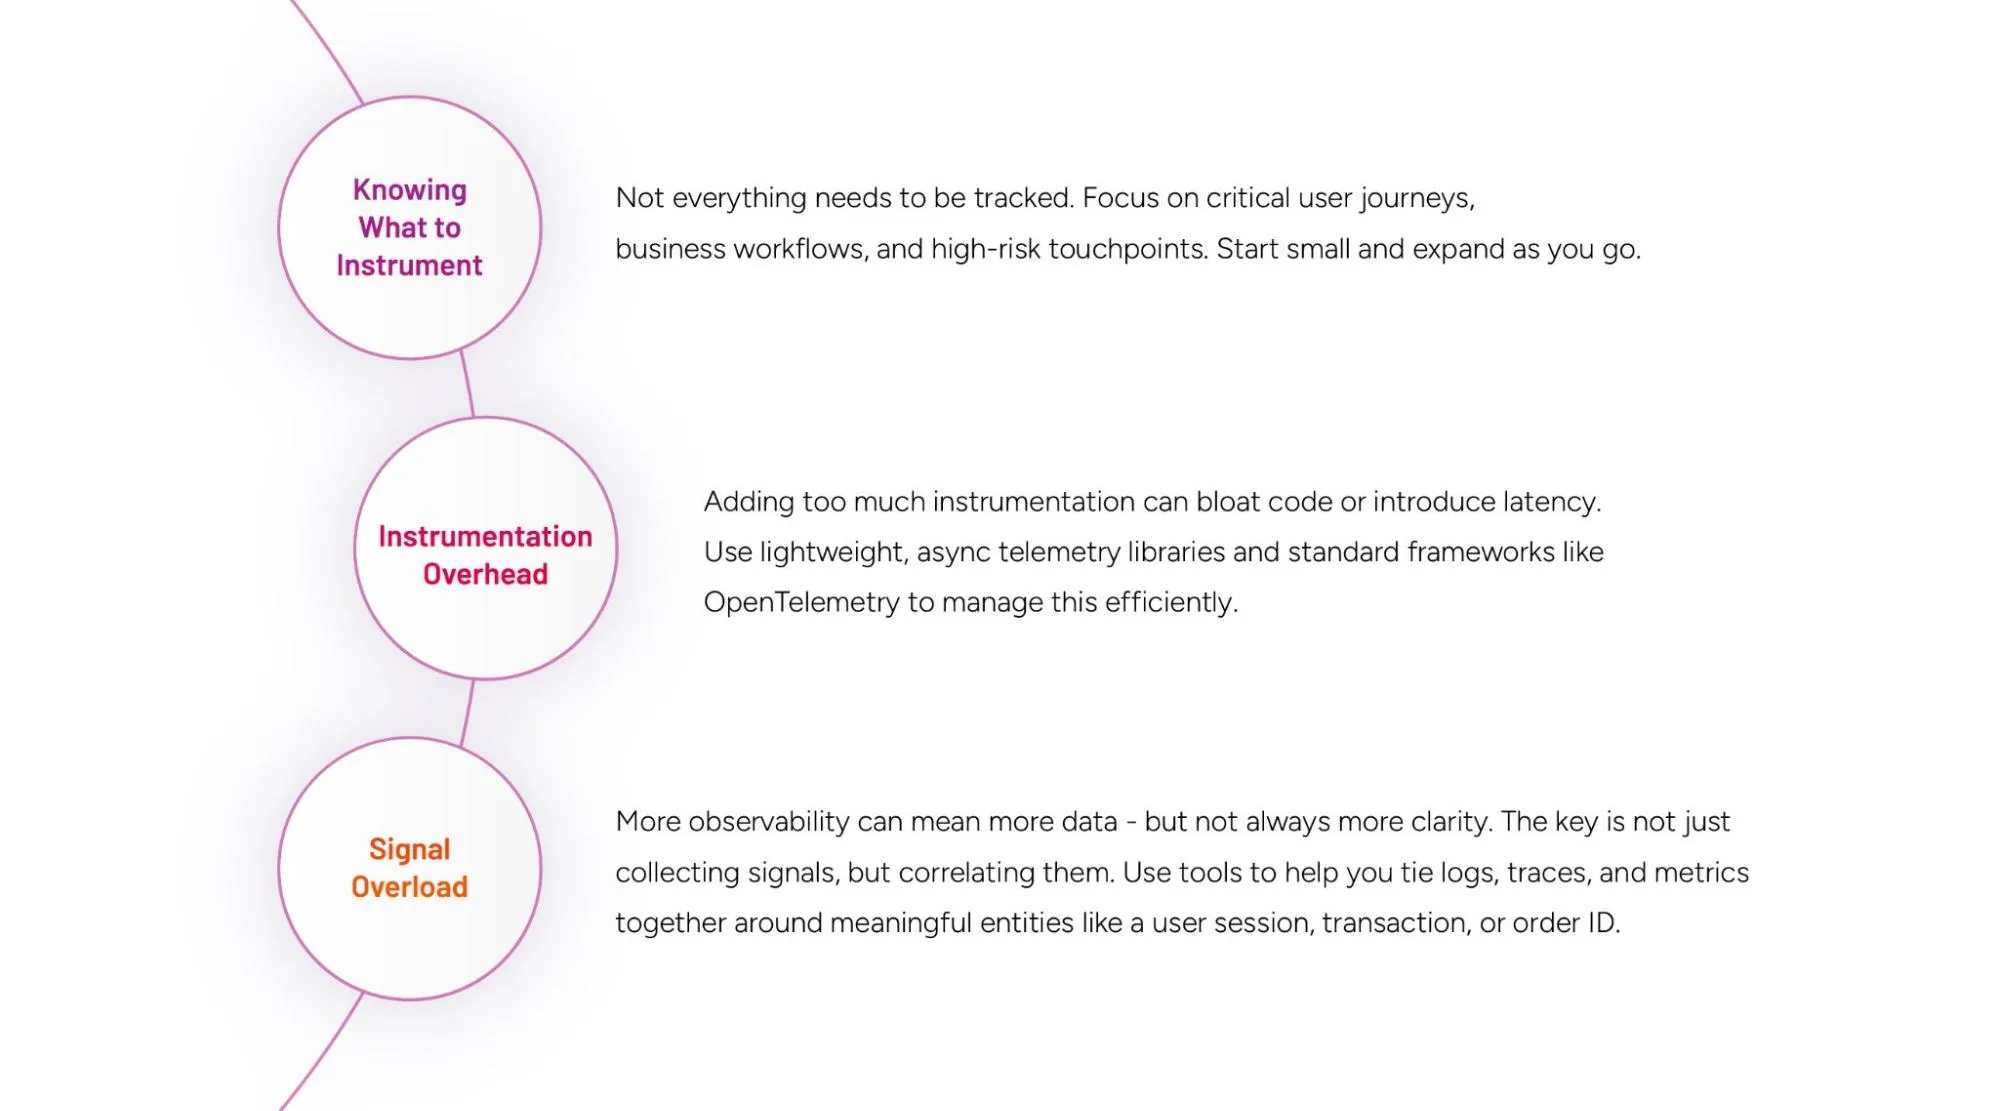
Challenges in Embedded Observability
Like any powerful approach, Embedded Observability comes with some hurdles:
How to Start Embedding Observability
Observability isn’t something that you bolt on later - it’s something you build from day one.
1. Design for observability from day zero
Embed instrumentation as you build. Code-level telemetry ensures that observability grows with your application, not around it.
2. Manually instrument critical business operations
While auto-instrumentation offers convenience, true observability comes from explicitly capturing business-critical flows like transactions, authentications, and payment authorizations.
3. Capture all exceptions—handled or not
Go beyond default error tracking. Use manual instrumentation to log even caught or silently handled exceptions—no blind spots allowed.
4. Make every log entry count
Every log should tell a meaningful story. Include relevant metadata, such as customer ID, transaction type, or latency, to make logs actionable and insightful.
5. Structure logs by layer and severity
Segment logs by functional services (Input, Processing, Output) and tag them by severity levels. This improves traceability, speeds up root cause analysis, and sharpens system performance insights.
6. Connect logs, metrics and traces for full context
Unified telemetry isn’t just a goal—it’s a necessity. Ensure your logs, traces, and metrics are linked, so every signal adds up to a clear narrative.
7. Define business-aware metrics from the start
Metrics like otp_latency, payment_drop_rate, or bank_response_time should be part of your system’s DNA—not an afterthought.
8. Embrace open standards like OpenTelemetry
Avoid lock-in and ensure flexibility by adopting open, community-driven telemetry standards that integrate seamlessly across your stack.
9. Make it cultural, not just technical
Observability isn’t just for SREs—it’s a feedback mechanism for developers, product teams, and business stakeholders. Embed it into your DevOps workflows as a first-class citizen.
Final Word: Built-in, Not Bolted-On
The biggest shift with embedded observability isn’t just technical—it’s cultural.
The strongest digital systems today aren’t the ones overloaded with dashboards. They’re the ones built from day one to understand themselves. When something goes wrong, they don’t go silent—they tell you exactly what, where, and why.
And in a world where digital experience is business, that’s non-negotiable.
Embedded observability makes this possible.
By instrumenting your systems from the inside out, you gain real-time visibility into both technical behavior and business impact. You don’t just detect problems; you connect them to outcomes and fix them faster.
But embedded observability is just the foundation.
The real impact lies in correlating and contextualising observability signals to business context to deliver actionable insights tied to real outcomes.
It’s not just about seeing more. It’s about understanding better—and acting faster.
Built-in. Context-rich. Business-aware. That’s the future of observability.