

Why Observability Migrations Are Difficult
For CTOs/CIOs, replacing Observability platforms often is equivalent to subjecting themselves to countless headaches. It is a large operational transition that touches production systems, application teams, infrastructure teams, SRE/NOC teams, security teams, business stakeholders, and leadership. Unlike many enterprise tools, observability sits close to live operations. It is used every day to detect failures, investigate incidents, measure system health, prove compliance, and understand customer or transaction impact.
This is why organizations hesitate.
Even when teams know their current observability platform has limitations (high cost, poor business context, fragmented visibility, limited support, noisy alerts, or dashboards that do not translate into action), they often choose to live with them. The perceived cost of migration feels higher than the expected advantage of moving.
A good example is Airbnb’s migration from a vendor-managed observability platform to a home-grown platform built on open-source technology. The migration involved moving observability data across 1,000 services, 300 million time series, 3,100 dashboards, and more than 300,000 alerts. Airbnb described this as a complex migration that required changes across instrumentation, collection, storage, querying, and visualization systems. At that scale, the challenge is more than technical migration; it is ensuring that engineering and operations teams can continue to run “business as usual” while the underlying observability foundation changes.
This is the reality for most large enterprises. Observability platforms accumulate years of operational knowledge: dashboards, alerts, thresholds, escalation rules, team habits, troubleshooting workflows, compliance reports, and executive views. Migrating them means more than moving data. It means preserving confidence.
Hence, it’s obvious for CIOs/CTOs to ask
Will the benefits of migration outweigh the risk, cost, disruption, and effort required to get there?
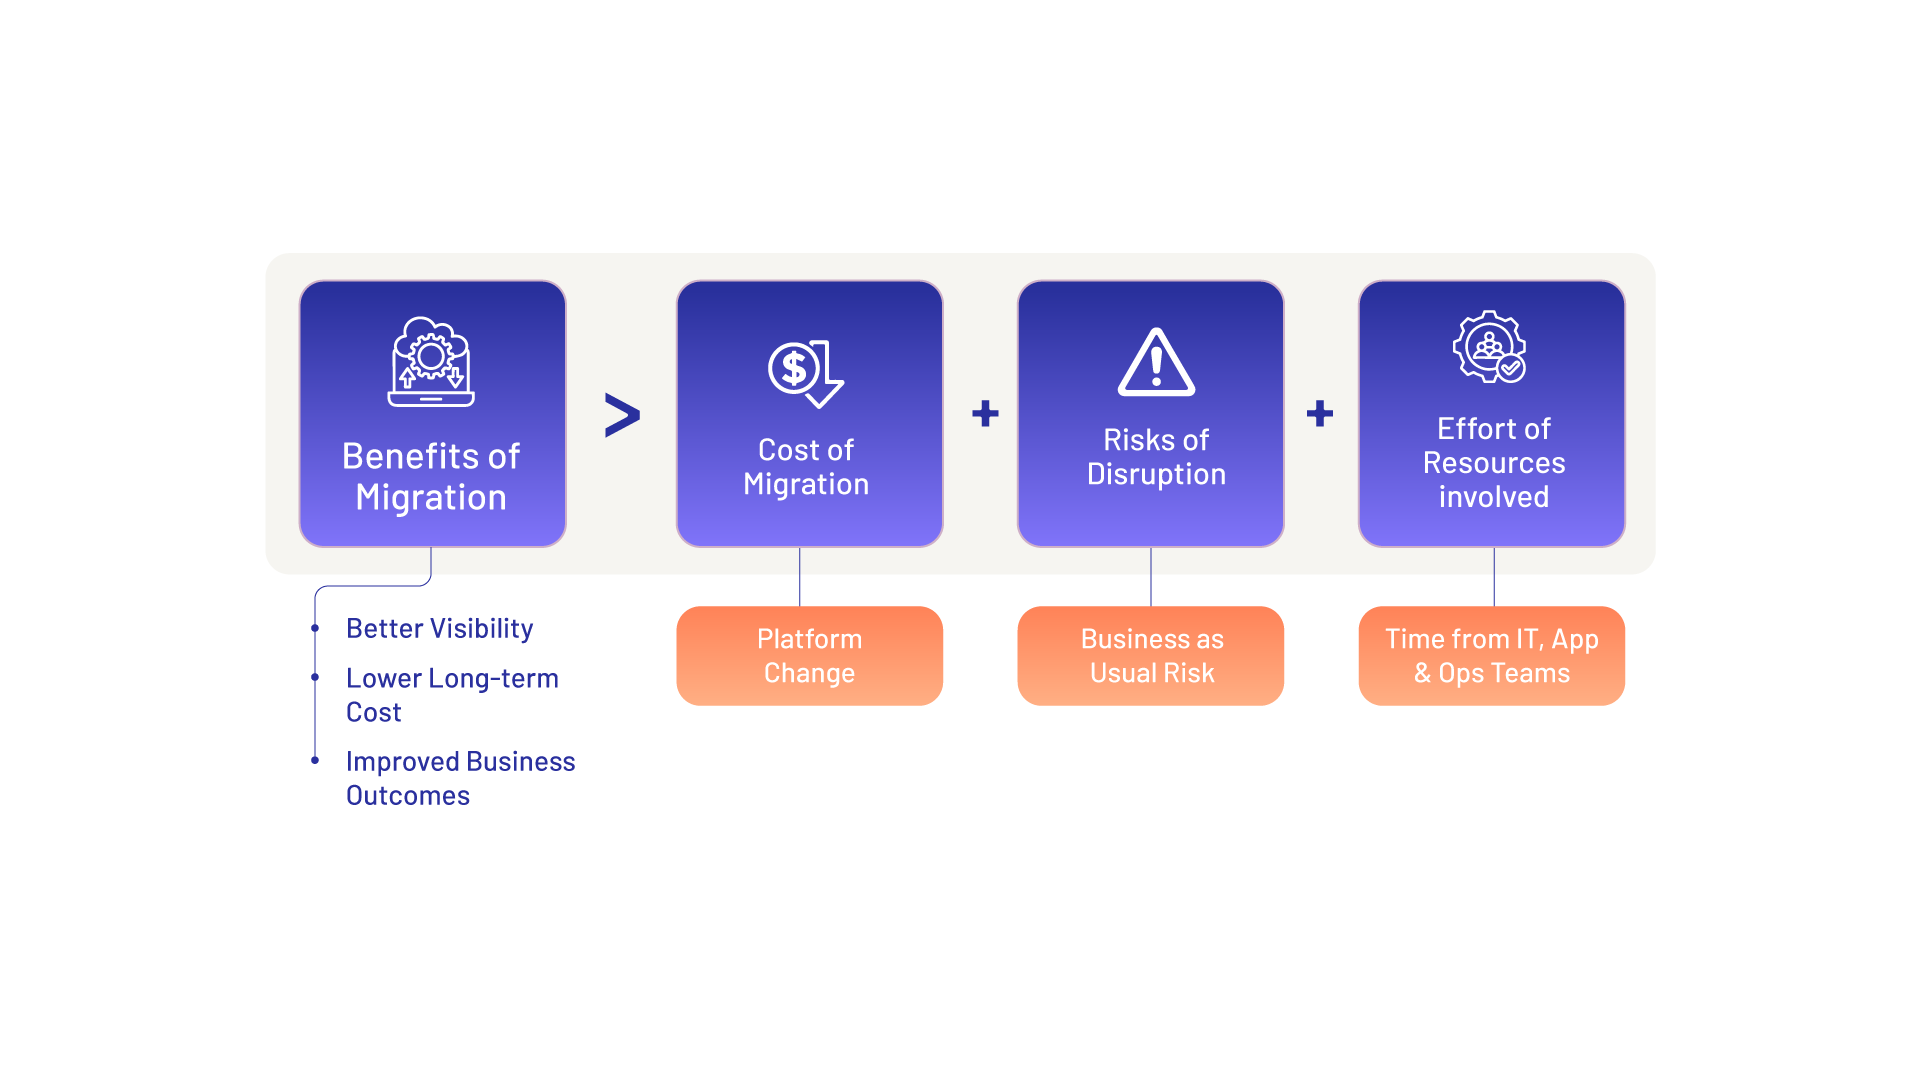
In many organizations, the answer is not obvious. The current platform may be expensive, fragmented, or inadequate, but it is familiar. Teams know where to look. War-room processes are built around it. Dashboards may be imperfect, but they are trusted. Alerts may be noisy, but teams know how to interpret them. This familiarity has value.
That is why observability migrations need to be approached differently. They cannot be positioned as a rip-and-replace exercise. They need to be designed as a phased transition where the organization continues to operate without disruption, while the new platform gradually proves that it can deliver better visibility, sharper context, and stronger business outcomes.
Approaches to Observability Migration
The story of every platform migration is different. Often the approach you take depends on the scale, effort, cost, current tool landscape, application maturity and the urgency to move.
1. Big Bang Replacement
In a big bang replacement, the organization moves from the current observability platform to the new platform in one major sweep. Applications, infrastructure, logs, metrics, dashboards, alerts, and users are shifted together.
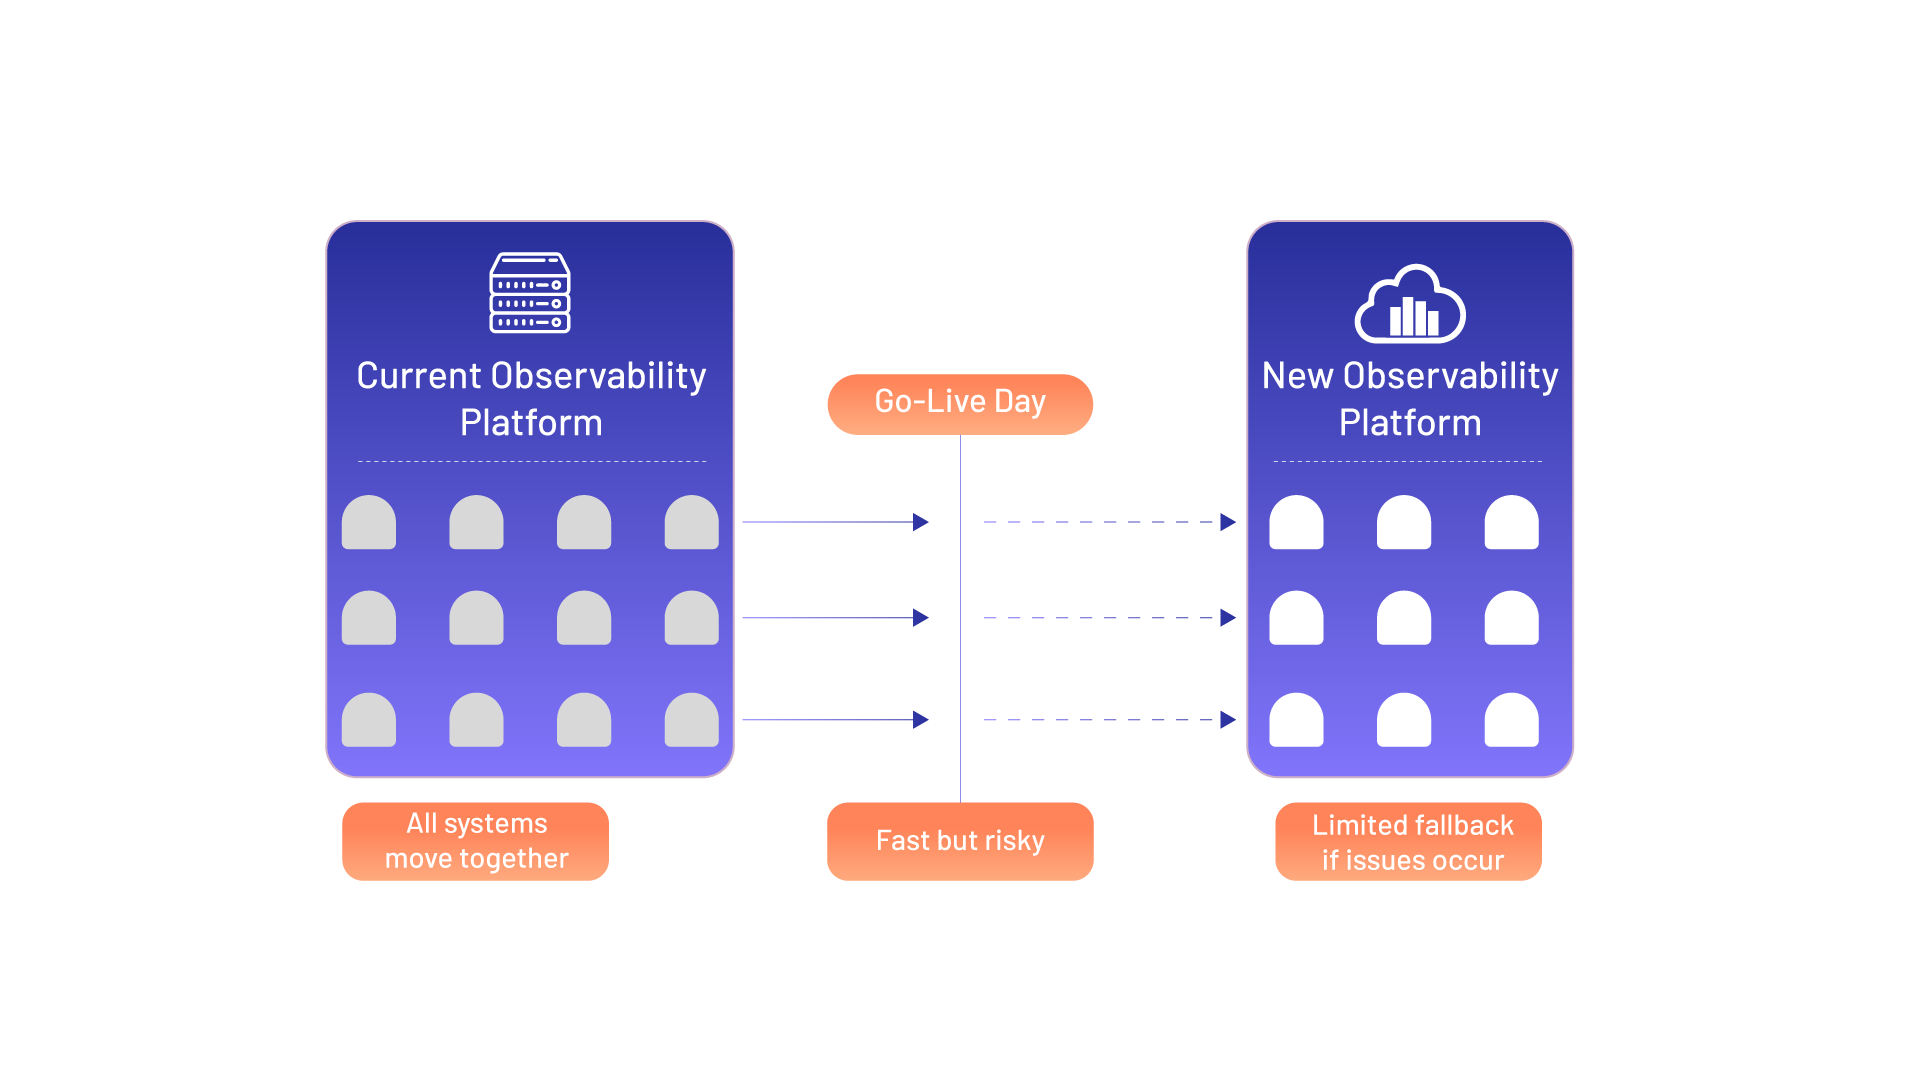
This approach can be faster when the existing setup is limited or when there is a strong urgency to exit the current platform. However, it also carries higher risk because teams have limited fallback if dashboards, alerts, integrations, or workflows do not behave as expected after cutover. For production-critical environments, this approach needs strong planning, validation, and executive alignment.
2. Progressive Migration
Progressive migration is a phased approach where the new platform is introduced gradually. The current and new observability platforms run in parallel while specific applications, telemetry sources, dashboards, alerts, or user groups are moved in stages.
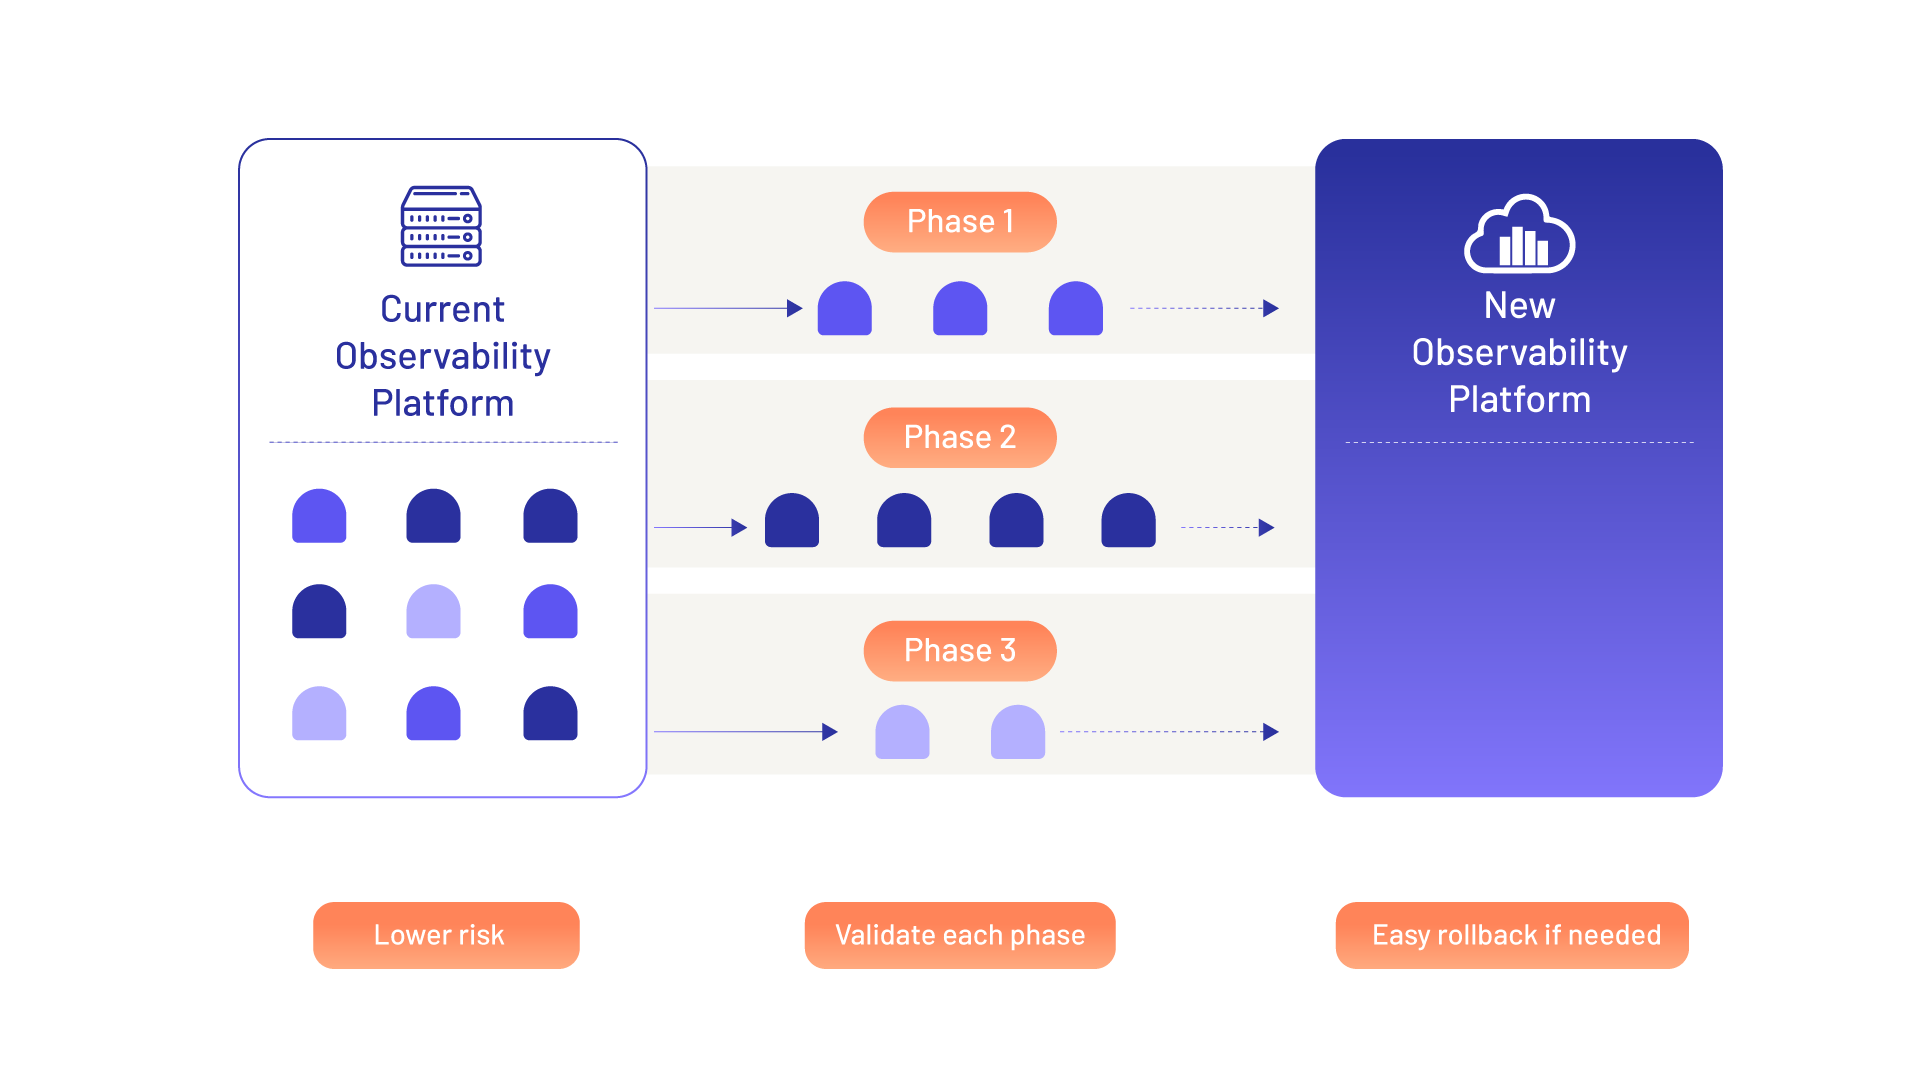
This is often the preferred approach for large enterprises because it reduces risk. Teams can validate each phase, compare outputs with the existing platform, build confidence, and cut over only when they are ready. It also allows the migration to be aligned with business priorities, starting with the most critical applications or journeys first.
3. Greenfield Observability Build
In a greenfield approach, there is no direct migration from an existing observability platform. Instead, the organization builds new dashboards, alerts, reports, and workflows from telemetry data that is already available or newly onboarded.
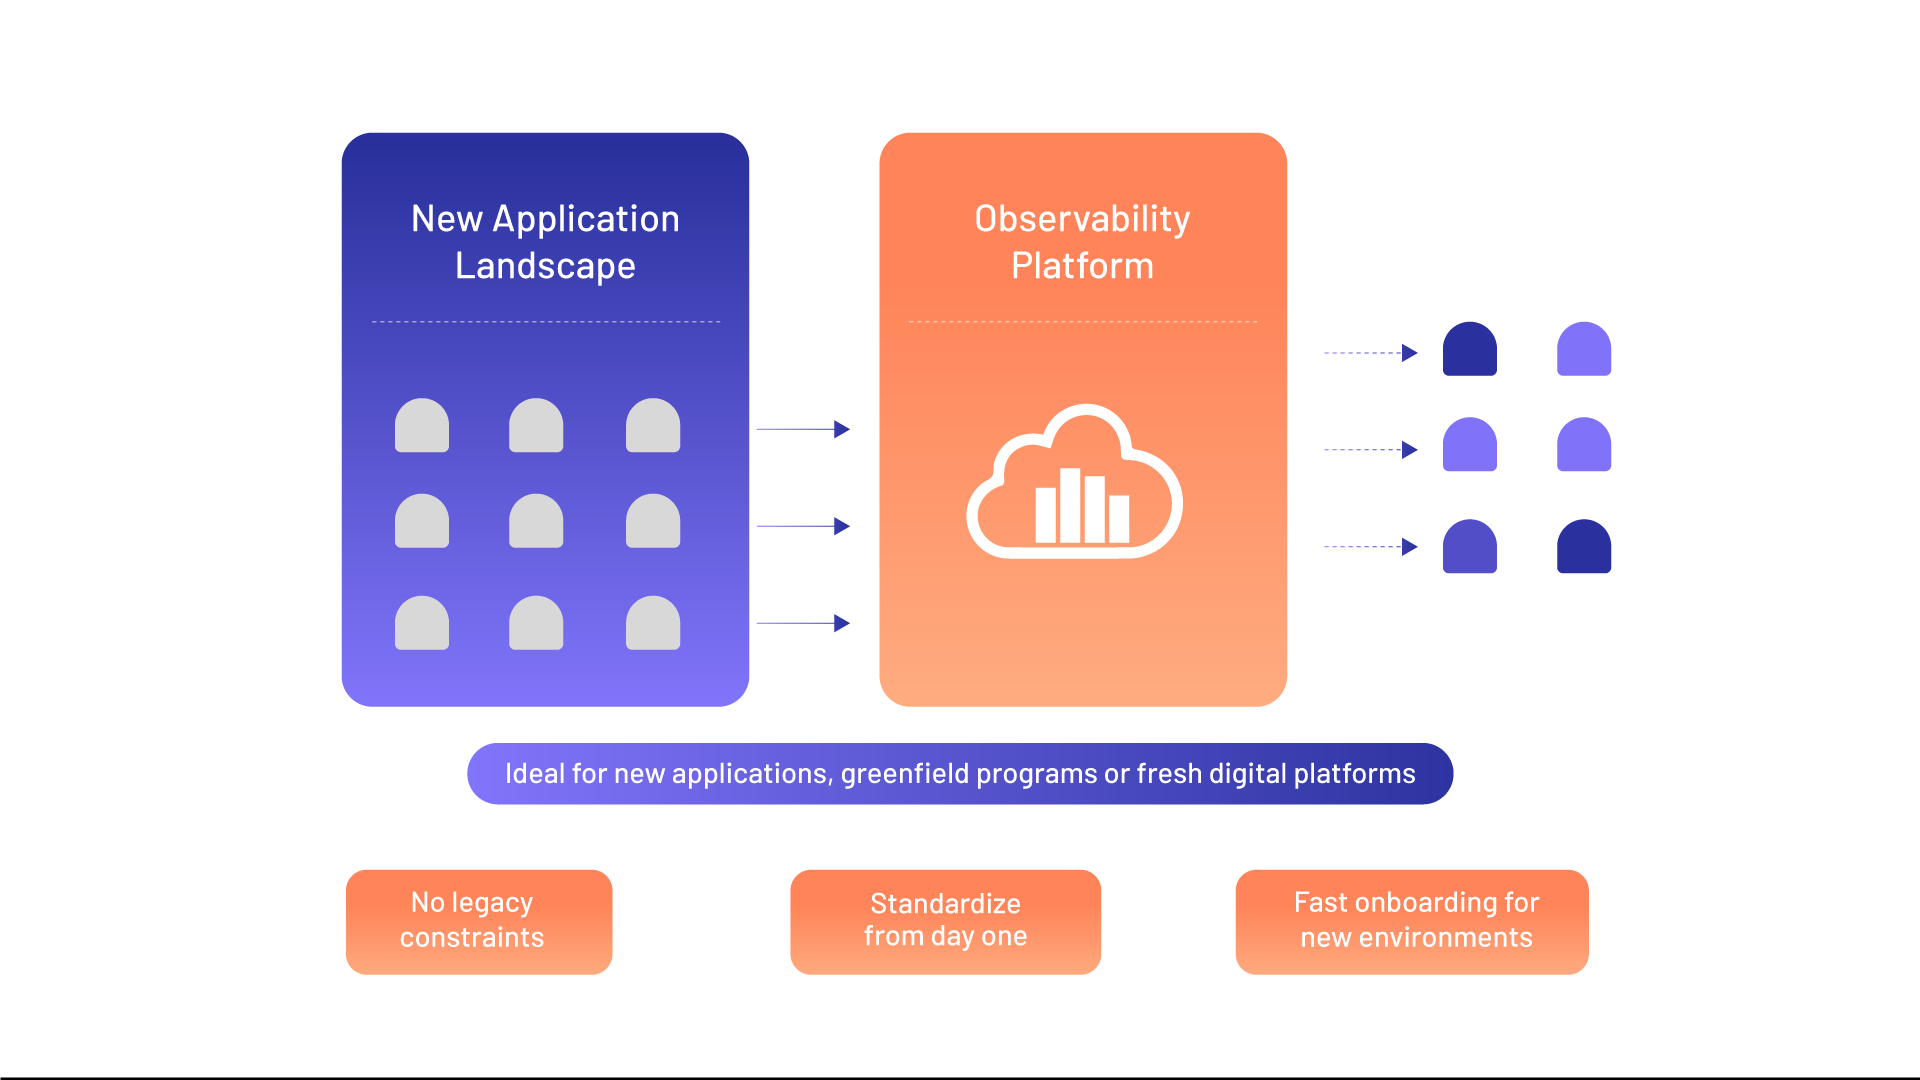
This approach is useful for new applications, new digital programs, or situations where the existing monitoring setup does not provide meaningful business visibility. Here, the goal is not to replicate legacy dashboards, but to build observability correctly from the beginning with the right telemetry, business KPIs, user personas, and operational workflows designed into the platform from day one.
How VuNet Handles Migration
At VuNet, we often start by understanding what the organization needs to observe, which teams need to act on those insights, and how the platform can connect telemetry to business impact.
This is why migration to vuSmartMaps follows a phased approach.
Phase 0: Pre-Discover
The transition begins with alignment. We work with key IT, application, infrastructure, security, and business stakeholders to understand the environment, expectations, timelines, dependencies, and success criteria.
At this stage, the focus is on creating clarity before implementation begins. This includes understanding the application and infrastructure landscape, security requirements, deployment prerequisites, stakeholder responsibilities, escalation paths, and the overall project plan.
The outcome of this phase is simple: everyone is aligned on what needs to be done, who needs to be involved, and what must be ready before the migration begins.
Phase 1: Discover
The discovery phase is where VuNet starts building context.
Rather than beginning with dashboards or agents, the team first understands the customer’s infrastructure, application architecture, transaction flows, logs, incident management processes, RCA workflows, and business KPIs.
This is an important difference. In most observability migrations, the tendency is to replicate existing dashboards and alerts. We don’t treat the current tool as the design reference. Instead, it uses the customer’s business processes, transaction behaviour, and operational needs as the starting point.
The outcome of this phase is a signed-off solution document that clearly defines what will be observed, how data will be collected, what KPIs matter, which personas will use the system, and how success will be measured.
Phase 2: Design
Once the context is understood, we create persona-specific storyboards, dashboards, alerting structures, reporting requirements, and data enrichment designs.
This phase is where change management begins. Before anything is deployed, the customer can see how different users will use the platform. For example, an IT operations leader may need a consolidated health view, an application owner may need service-level performance visibility, while a business team may need success rates, transaction volumes, turnaround time, or channel-level impact.
Every visualization is mapped to a user persona and reviewed before configuration begins.
This ensures that the new platform is not just technically functional, but operationally usable.
Phase 3: Deploy
In the deployment phase, data collection and platform configuration begin.
We install and configure the required agents, validate connectivity, set up data ingestion, enrich telemetry, configure dashboards, build alerts, create reports, and enable workflows.
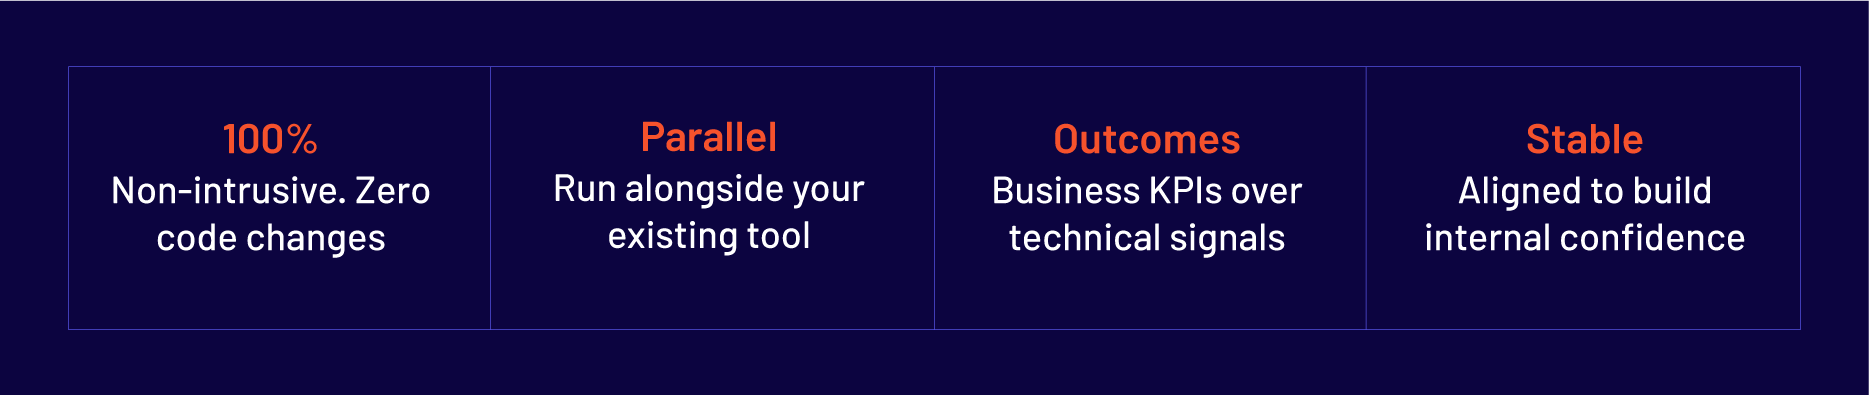
A key principle here is limited disruption. vuSmartMaps™ is designed to be deployed without forcing application teams to rewrite code or change their development process. With OmniAgents, data collection is streamlined through a unified agent framework that enables telemetry collection from target systems with minimal intrusion.
During this phase, VuNet can also run in parallel with the customer’s existing observability platform. This is critical because it allows teams to compare, validate, build confidence, and avoid a risky big-bang cutover.
Phase 4: Deliver and HyperCARE
The final phase is all about adoption and stabilization.
VuNet conducts stakeholder showcases, incorporates feedback, delivers domain-specific user training, provides an operation manual, and supports the customer through the cutover process.
At this stage, we assess how teams are using the new platform in real operational scenarios, identify usage patterns, and recommend process improvements that help them detect, diagnose, and resolve incidents faster.
Post go-live, VuNet continues with hypercare until the environment is stable and the teams are comfortable using the platform in day-to-day operations.
What Makes VuNet’s Migration Approach Different
1. Context is All You Need
Our migration often begins with the question
“What do you need to understand about your business and operations?”
While we evaluate their current dashboards, alerts, and active services, the overall focus is on having a holistic view of delivering better operations.
This difference matters. Existing observability platforms often show system metrics, infrastructure signals, traces, logs, and service-level information. But the business interpretation is left to users. Teams still have to infer whether a spike in latency affected high-value transactions, whether a channel failure impacted customers, or whether an infrastructure issue affected a payment journey.
vuSmartMaps™ is designed to add this missing context.
It correlates telemetry with business KPIs, transaction behaviour, user journeys, and operational workflows. The result is not often about solving incidents faster, but rather making better decisions all across the operational team.
2. Greenfield Migration to Reduce Risk
Observability migrations become risky when organizations are forced into a big bang replacement.
VuNet avoids this by supporting a parallel-run approach. The existing tool and vuSmartMaps™ can run side by side during the transition. This allows teams to validate dashboards, compare alerts, check data accuracy, review KPIs, and build operational confidence before cutover.
This is especially important for large enterprises where observability is deeply embedded into daily operations. Parallel running helps preserve business as usual while the new platform gradually proves its value.
3. OmniAgents for Limited Disruption
One of the biggest fears in observability migration is disruption to application and development teams.
VuNet addresses this through OmniAgents, which are unified agents designed to streamline data collection across target systems. The intent is to collect and stream telemetry without requiring application code changes or intrusive changes to production systems.
For development teams, this means the migration does not become an additional engineering burden. For operations teams, it means telemetry collection can be standardized and managed more efficiently. For leadership, it reduces the perceived risk of touching production applications.
4. Deep Triage Built into the Team
Observability migrations often hit complex issues around agents, infrastructure dependencies, data ingestion, connectivity, and environment-specific configurations. VuNet brings deep triage capability directly into the implementation team, so these issues can be investigated and resolved in real time instead of being routed through long escalation cycles.
Our engineers work closely with customer teams during deployment and stabilization to troubleshoot agent and infrastructure scenarios in the room. The platform is also designed for easier customization, with pre-built views, low-code adapters, and workflow-first design. This helps customers adapt vuSmartMaps to their operating environment faster, while reducing delays during migration and improving confidence before cutover.
5. Improving Adoption from the Design Phase
A technically successful deployment can still fail if users do not adopt the platform.
This is why VuNet treats adoption as a design requirement rather than a post-go-live activity. During the design phase, dashboards and storyboards are created around specific personas and use cases. The platform is configured based on how different teams actually work, not based on generic templates.
Role-specific views, domain-specific training, alert handbooks, and operation manuals help users understand what to look at, how to interpret signals, and how to act on insights.
This improves trust in the new platform. And in observability, trust is everything. If teams do not trust the dashboard or alert, they will continue to fall back on the old tool.
6. Post-Live Support Until the Environment Stabilizes
Many implementations end when the platform goes live. VuNet’s approach goes further.
The same solution team that participates in discovery and design continues through deployment, training, cutover, and hypercare. This continuity matters because the team understands the customer’s architecture, business processes, KPIs, alerts, and operational priorities.
VuNet stays engaged until the environment is stable, users are confident, and the platform is actively helping teams respond to real operational scenarios.
Case Study: From Cost Pressure to Wider Business Visibility
A leading financial services organization was running a global observability platform. They had complete system-level visibility across their critical applications - Instant payments, digital banking, core banking, etc.
But their challenge was scalability, predictability, and business relevance. As the bank’s infrastructure and application footprint grew, the cost of the existing platform started increasing sharply. Every expansion in coverage created additional commercial pressure. The teams also needed better visibility across critical applications.
That is when they approached VuNet.
VuNet proposed a phased migration approach, where, during pre-discovery, we understood their broader goals and understood the application landscape, operational workflows, transaction flows, key logs, existing dashboards, and the KPIs that mattered to different users.
Each phase focused on a defined business or application area, allowing the customer to validate the dashboards, alerts, reports, and operational workflows before expanding further. Over time, customers started seeing better visibility. Dashboards and alerts were built around the customer’s specific workflows.
Once teams started using vuSmartMaps, they began asking for similar visibility across their non-critical applications as well.
Summary
Every observability platform implementation is technically straightforward. But technical implementation isn't what keeps your teams up at night. What keeps them up is the gap between what the platform shows and what the business needs to know. And whether the team using it trusts it enough to act on what it says.
Our implementation closes this gap. Not with a feature list but with a focused approach. With domain expertise built inside BFSI operations. With engineers who troubleshoot in the room, not on a ticket. With a change process that starts at the design phase, not during the training session. And with a support model that measures success by your team's confidence.
Often, we optimise migrations for outcomes.