According to the Flexera 2021 State of the Cloud Report, enterprises continue to embrace multi-cloud and hybrid cloud strategies and are increasing spend with vendors across the board, citing a higher-than-expected cloud usage due to the COVID-19 pandemic restrictions throughout 2020. Enterprises have almost entirely embraced multi-cloud; 92 percent of respondents reported having a multi-cloud strategy. Eighty-two percent are taking a hybrid approach, combining the use of both public and private clouds (Figure 1).
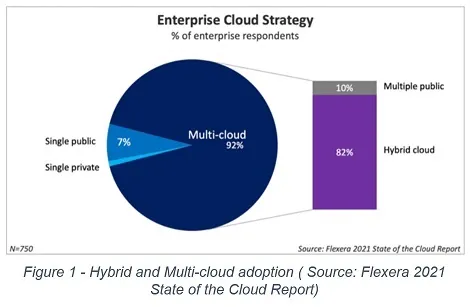
In a hybrid cloud approach, enterprises split the workloads across the public cloud and on-premises. In a multi-cloud approach, enterprises run workloads with more than one public cloud provider.
Although cloud has given amazing capabilities like speed, agility, resilience, auto-scaling, auto-patch-updates, it has made application delivery amazingly complex. Each cloud provider provides their own set of tools. Amazon AWS offers more than 1,000 services today and counting. Google Cloud Platform offers 100 plus products and each product offers many services. Microsoft Azure and Azure stack offers 100 plus products and services as well. The application developer needs to know the tools specific each cloud provider and faces the complexity of assembling all the bits and pieces into a working application.
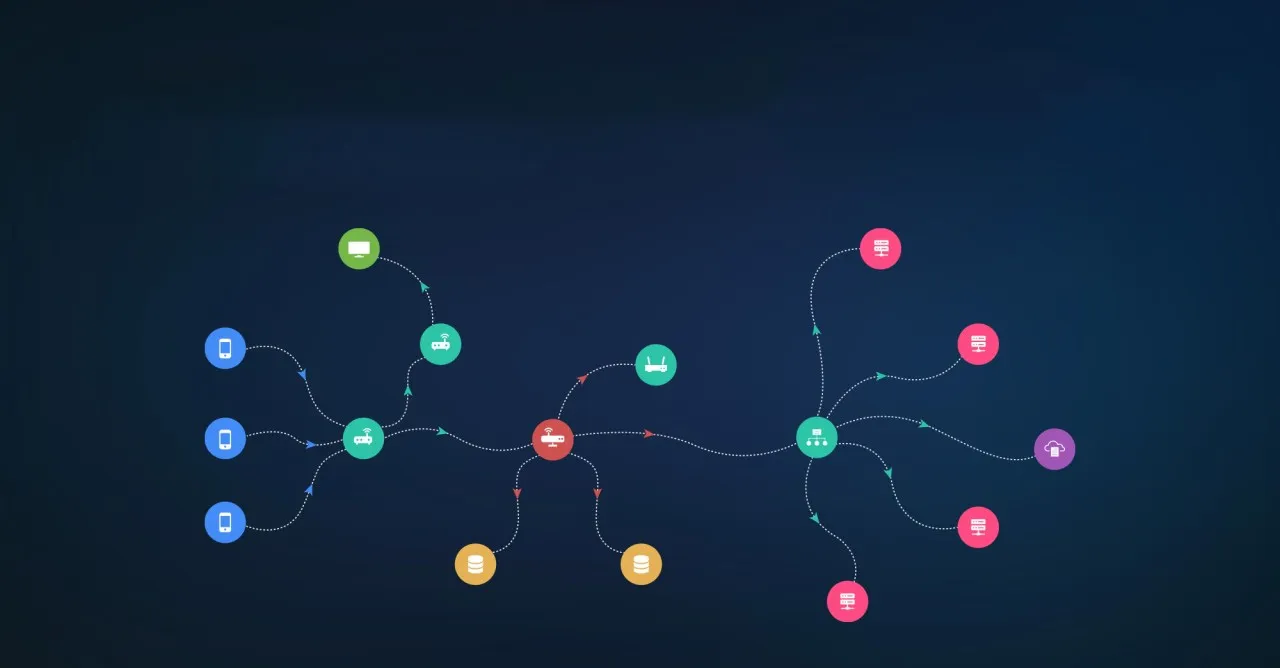
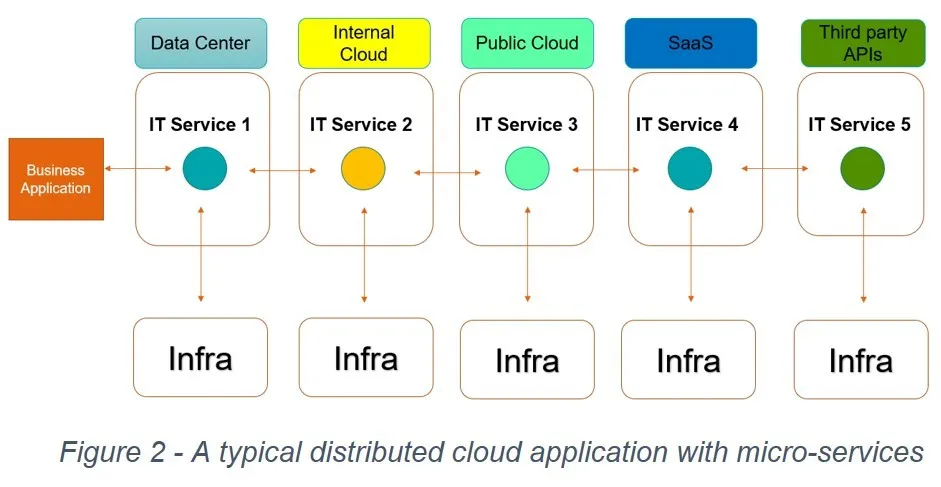
From monitoring viewpoint of cloud applications, a hybrid and multi-cloud application introduces enormous complexity as compared to applications running on a single cloud provider or a single data center. For example, an outage that impacts the SLA of an application could be caused by one or microservices running in a data center or internal (on-prem) cloud or a public cloud or a SaaS provider or by third party APIs as illustrated in Figure 2:
A traditional Application Performance Management (APM) tool can look at the logs, events and metrics of micro-services and can tell you about high CPU usage on a service, but not why that high CPU is occurring. A traditional APM too can also not tell you the impact of that high CPU across requests throughout your system. To ask the right questions and explain why something is happening, you need the complete picture from your data sources, the context and correlation. While it may be necessary to sample data sources, the aggregates must be 100% accurate 100% of the time.
In other words, getting visibility of a business transaction by assembling its overall end-to-end flow and reporting transaction insights through logs, events, metrics is not enough to monitor a distributed application running in hybrid and multi-cloud environments. Static monitoring dashboards with human-generated thresholds do not scale to these distributed applications and are inflexible in assisting the resolution of unforeseen events.

We need Observability for distributed applications.
Observability is the characteristic of systems that allows them to be “seen” and allows questions about their behavior to be answered. When you think about observability, you should think about data collection with context and correlation provided by distributed tracing. You know you have achieved observability when you can ask arbitrary questions about your environment and explain why they are happening. Traditional APM monitoring tools were not built to deal with issues in microservice-based architectures through observability.
Distributed tracing is the collection of data related to end-to-end requests within an application. A trace is made up of one or more spans where a span represents a call within the request. A call may be a microservice or a function within a microservice. The general structure of a trace looks like the following (Figure 3):
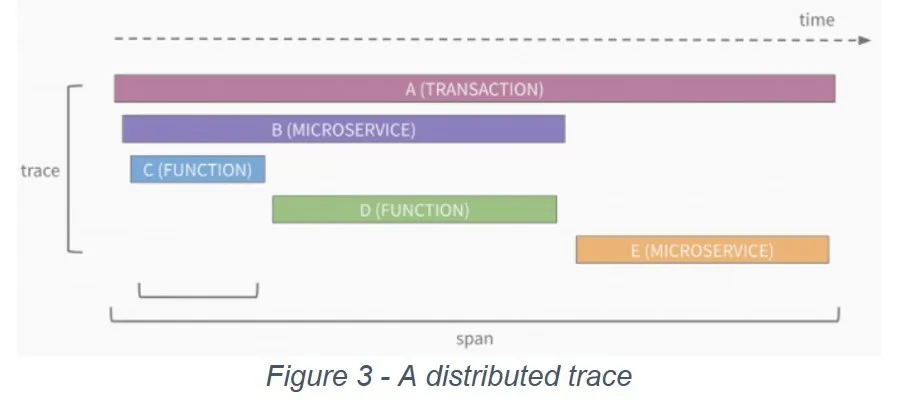
The first span in a trace is known as the root span. One or more child spans can follow the root span. Child spans can also be nested further. A span includes a service name, operation name, duration, and optionally additional metadata.
Distributed tracing works through the instrumentation of libraries used in applications. The instrumentation handles creating unique trace/span IDs, keeping track of duration, adding metadata, and tracking context. The context part – known as context propagation – is actually the most critical. It is responsible for passing context between function/microservice calls. For distributed tracing to work properly, all services within a request must use the same context propagation format.
An open-source distributed tracing tool like Zipkin or Jaeger or OpenTrace can correlate the data from all the spans and format them into visualizations that are available on request through a web interface.
However, effective correlation of your business transactions running across distributed systems require much more than a distributed tracing. That is where an AIOps solution like VuNet’s vuSmartMaps™ platform can make a huge difference to your organisation. Here are three critical capabilities you need think about when it comes to correlating your business transactions:
First, any troubleshooting starts with some form of higher-level abstraction of what went wrong along with some context, especially the services that run on complex distributed infrastructures. Examples:
- Where do users drop out?
- What causes a decline of the transaction?
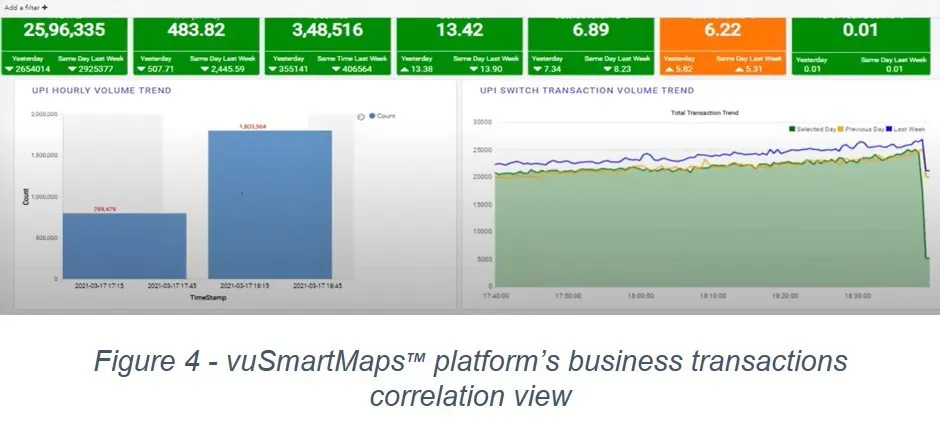
vuSmartMaps™ platform can provide a contextual dashboard ( Figure 4) that provides your business stakeholders visibility by correlating business transactions to a higher-level context your business leaders care about.
Second, the trouble shooting engineers typically require not necessary volume of data to sift through but just the relevant ones to pay attention to because time is the essence. Examples:
- In what steps of the journey do customers experience pain?
- Are they business process related or IT services related or a combination?
- Which geographical regions have bottlenecks in the customer experience?
- Which IT services need capacity augmentation?
- Which third party APIs and systems are in the path of customer journey?
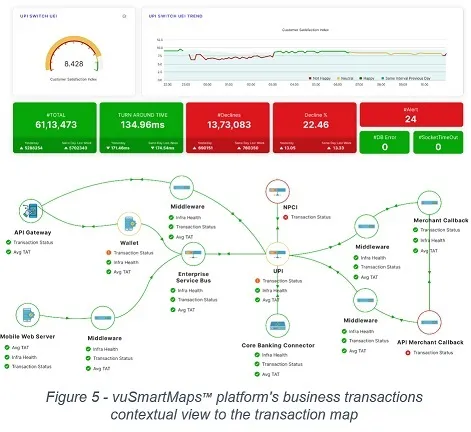
vuSmartMaps™ platform correlates the business transactions (Figure 5) to the unified transaction system map of your business application so your operations teams can:
- navigate quickly what caused the specific transaction declines
- correlate to the system view at the appropriate granularity for quick troubleshooting.
Third, unified visibility strives for providing correlation and context to operational data – not just from traces but also from logs, events, alerts, metrics and other monitoring tools. Examples:
- How can we reduce the touch points to simplify the experience?
- Are the SLAs of the third-party services in place to support the customer experience?
- In which services business and IT need to invest more to reach the desired customer experience?
- In which services business and IT should stop investing as they do not add any value to customer experience journey?
- What is the peak hour traffic?
- Did the users choose the online chat with support?
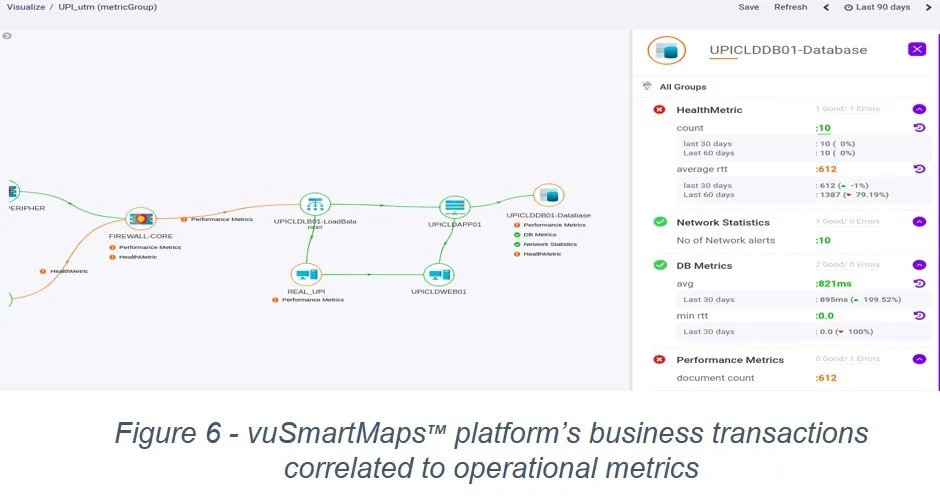
vuSmartMaps™ platform provides information available in a clean and easy-to-read dashboard (Figure 6), enables easy digestion and quick decision making on questions such as above.
From AIOps platform perspective, the goal of customer journey mapping service is to help its stakeholders build the customer journey maps, correlate the business transactions, build visibility and insights on them.
Key Takeaways
1. Hybrid and multi-cloud applications run tens and hundreds of micro-services distributed across multiple cloud environments. Monitoring distributed applications to provide visibility into customer journey and business transactions is challenging.
2. You need observability built into distributed applications to allow internal traceability of the flow of transactions within the system. With this kind of mindset and new method to monitoring, you will be able to draw good insights into the workings of applications as they are running and also be able to predict issues before they escalate to eventually become incidents.
3. Effective correlation of your business transactions running across distributed systems require context and correlation, not typically addressed by traditional APM tools.
4. Investing in an AIOps solution that addresses traditional monitoring from logs, events, metrics and traces and also observability to correlate business transactions is a critical step for your cloud strategy. VuNet’s vuSmartMaps™ AIOps platform is built to address monitoring and observability distributed applications use cases at scale.
5. VuNet’s vuSmartMaps™ AIOps platform monitors more than 3 billion transactions a month, across various verticals and some of the largest banking, financial services and insurance enterprises.
✍ Srikanth Narasimhan, the author of the article, is a Technical Advisor @ VuNet Systems. He is an Enterprise Architect and has served as a distinguished engineer at Cisco.
VuNet Systems is a deep tech AIOPs startup revolutionizing digital transactions. VuNet's platform vuSmartMaps™, is a next generation full stack deep observability product built using big data and ML models in innovative ways for monitoring and analytics of business journeys to provide superior customer experience. Monitoring more than 3 billion transactions per month, VuNet's platform is improving digital payment experience and accelerating digital transformation initiatives across BFSI, FinTechs, Payment Gateways and other verticals.