


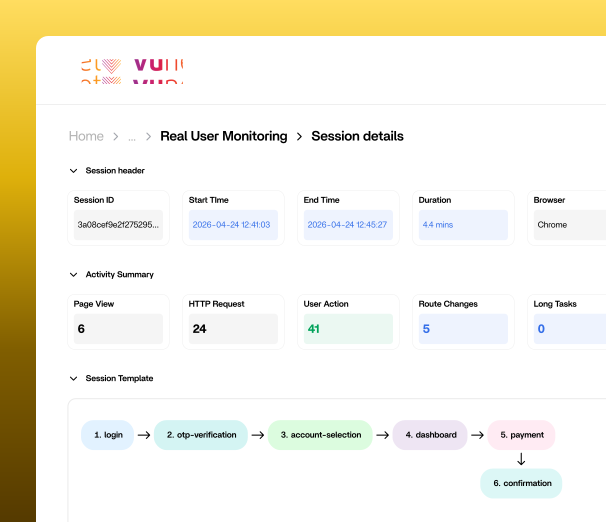
What Is BRUMLens?
It captures browser sessions, page loads, clicks, API calls, frontend errors, and trace context to show performance, usability, and failures journey by journey.
It supports modern web applications built on React, Angular, Flutter, Vue, Next.js, Nuxt.js, and traditional multi-page applications.
Why BRUMLens?
Most tools only show that something is slow.
BRUMLens shows who felt the issue, where it happened, what caused it, and how it connects to backend performance. It turns vague browser complaints into clear, ranked, actionable evidence, from the exact session and page to the user action, API call, trace waterfall, and failure context.
How BRUMLens Fits in vuSmartMaps™
BRUMLens works inside vuSmartMaps™ alongside application, infrastructure, logs, and business journey observability.
Teams can connect user experience with system performance and business impact in one place, instead of monitoring browser data separately.
What BRUMLens Helps You Do
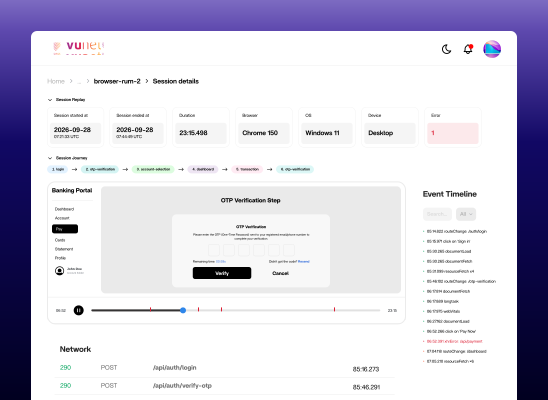
Replay the User Journey
See what the user did before, during, and after an issue with session replay and click timelines.
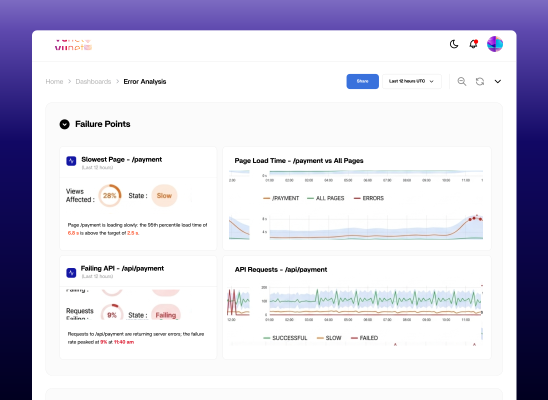
Find the Exact Failure Point
Identify slow pages, broken sessions, affected geographies, failing APIs, JavaScript errors, long tasks, UI hangs, and rage clicks.
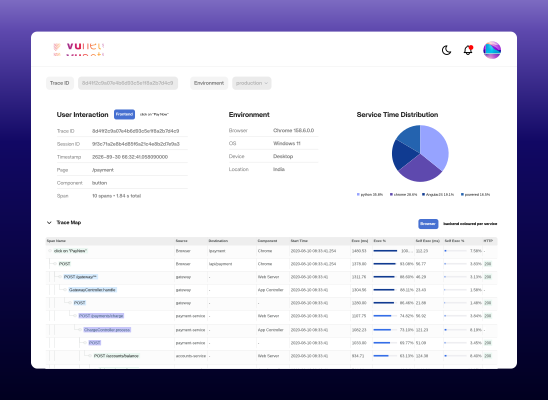
Connect Frontend to Backend
Correlate browser requests with backend traces and waterfall views to see whether the issue is in the frontend, network, API, or backend service.
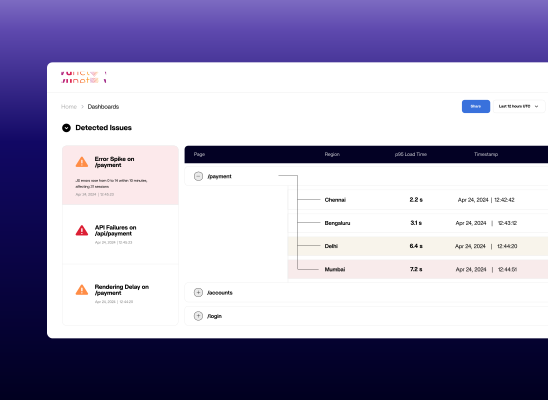
Detect Problems with Smart Alerts
Built-in alerts help spot slow pages, API issues, rendering delays, regional slowdowns, error spikes, and network problems.
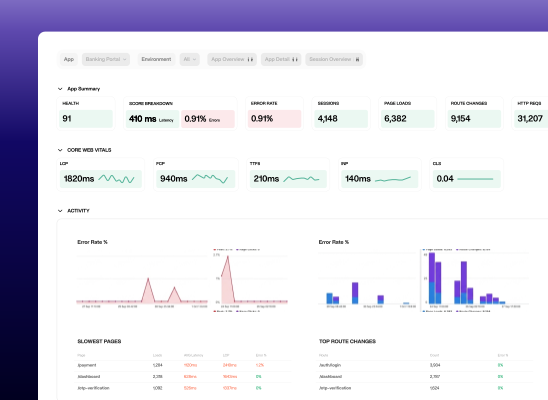
Use Ready Dashboards
Get out-of-the-box views for app overview, page load, HTTP requests, route changes, sessions, errors, latency, throughput, and trace waterfalls.
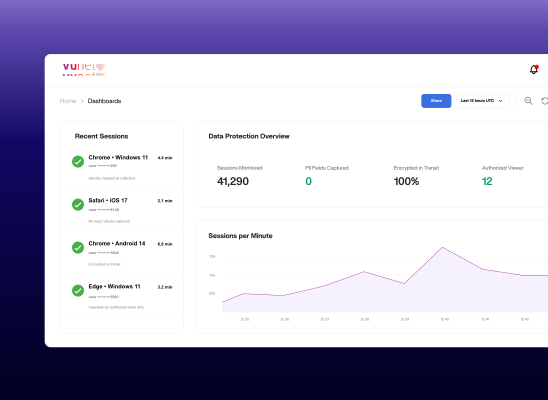
Protect User Data
Support enterprise monitoring with PII masking, consent-aligned controls, encryption, RBAC, and audit trails.
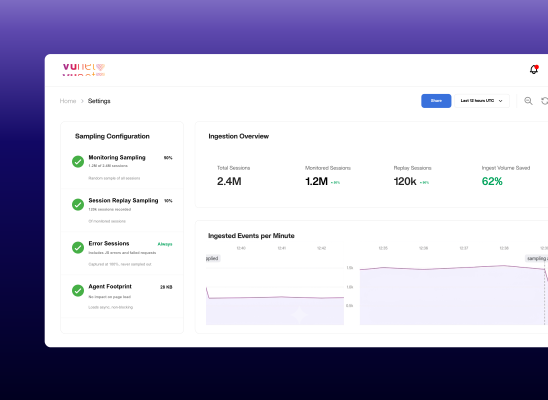
Scale Reliably
Use a lightweight, non-blocking browser agent with configurable sampling for high-volume web applications.
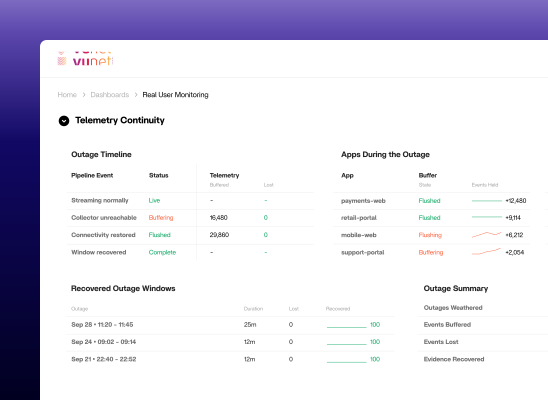
Keep evidence during outages
Telemetry is buffered locally when collectors are unreachable and flushed when connectivity returns, so incidents do not erase their own evidence.
How It Is Deployed
BRUMLens uses a lightweight browser agent added to monitored web applications. The agent collects browser-side telemetry and sends it to vuSmartMaps™ for dashboards, alerts, session replay, and trace correlation.
What Teams Get

Faster root cause analysis

Real user journey visibility

Clear view of frontend, API, network, and rendering problems

Early detection before customer complaints grow

Fewer blind spots between frontend and backend teams

Privacy-focused monitoring

One connected view inside vuSmartMaps™
