

When the pandemic struck, enterprises were thrust into an era of “remote everything.” In the rush to maintain business continuity, enterprises scrambled to adopt any monitoring tools they could find. The result? Many enterprises found themselves juggling fragmented monitoring solutions and legacy systems, leading to siloed data, higher costs and limited visibility, all while chasing the elusive goal of end-to-end visibility.
Now, in a world where digital transformation timelines are collapsing and complexity in tech stacks are ballooning, the question is no longer whether observability is critical — it’s how fast enterprises can unify and scale it to drive real innovation.
The observability market is projected to grow rapidly, and rightly so. As enterprises shift from reactive troubleshooting to predictive insights, the need for a unified observability approach has become a strategic imperative — one that transforms how operations are managed, optimized, and future-proofed.
Why Most Enterprises Struggle to Leverage Observability Effectively
Despite increasing awareness and investment, many enterprises still struggle to unlock the full value of observability. The root causes are deeply embedded in legacy infrastructure, fragmented data, and disjointed tools.
Fig 1: Challenges in realizing the full potential of Observability
1. Fragmented Data and Siloed Monitoring
One of the biggest roadblocks is data silos. Logs, metrics, traces, and business events are often collected and analyzed separately, limiting IT teams’ ability to track complete transaction journeys. This fragmentation slows down root cause analysis, increases the cost of generating insights, and ultimately hinders timely, informed decision-making.
The proliferation of multiple monitoring tools — each focused on a specific domain like infrastructure, applications, or logs — adds further complexity. Native systems rarely integrate well, making it nearly impossible to generate a unified operational view.
2. Lack of Data Standardization
Without a common data model, monitoring tools often interpret information differently. Teams build ad-hoc dashboards tailored to local needs, using their own definitions and visualizations. This leads to redundant efforts, inconsistent insights, and a lack of trust in the data across teams. The absence of a standardized, centralized observability platform prevents interoperability and long-term scalability.
3. Hidden Costs and Manual Overheads
The inefficiencies introduced by tool sprawl and manual processes lead to significant hidden costs — from redundant tooling expenses and infrastructure overhead to countless hours spent in war rooms, troubleshooting with incomplete context. Decision-makers often underestimate these long-term costs, only to realize later that they’ve lost valuable time and resources without meaningful business outcomes.
4. Locked-in with Legacy Tooling
Over the years, many enterprises have accumulated a patchwork of APM tools, log analytics platforms, infrastructure monitors, and custom scripts. As observability needs evolved, these tools remained fragmented, outdated, and difficult to scale. Efforts to build in-house observability architectures often face escalating costs, long delays, and diminishing returns — ultimately locking organizations into systems they can no longer evolve.
To overcome these challenges, organizations need to shift from fragmented monitoring to an AI-powered business-centric observability platform, a unified, scalable, and intelligent foundation that transforms not only how you monitor your systems, but how you run your business.
This approach unifies technical telemetry with deep business context to deliver:
⦁ Complete visibility across user journeys and transaction flows
⦁ Actionable insights aligned with business goals and outcomes
⦁ Predictive analytics for proactive resolution
⦁ A single source of truth for IT and business teams alike
Business-centric observability doesn’t just monitor systems — it empowers transformation across the enterprise.
Why a Strong Data and Context Strategy Must Come First
Before organizations can unlock the full power of AI-powered business observability, they must first get one thing right: their data and context strategy.
As digital transactions grow and business workflows become more complex, observability data becomes hard to manage. AI models of business-centric observability platforms are only as good as the data they’re trained on — and in most enterprises, data is fragmented, unstructured, and spread across multiple systems and vendors. Without integrated, standardized, clean data and layering it with the right business context, any AI driven business observability efforts often fall flat. And without a deep understanding of workflows, transactions, and dependencies and integrating with observability, there’s no way to turn raw data into actionable insight to drive business outcomes.
As Tyler Cowen wisely noted, “Context is that which is scarce.” And in business observability, that context comes from:
⦁ Unified data models across all observability sources
⦁ Mapped workflows and business journeys to show how systems interact and impact business outcomes
⦁ Integrated data pipelines that overcome silos and support real-time analytics
⦁ Security, governance, and role-based access to ensure trusted usage
Enterprises that skip this foundational step end up facing delays, poor insights, and rising costs as complexity increases. They spend more time troubleshooting tools and stitching together systems than solving real business problems.
That’s why building a unified platform with a strong data and context layer is essential. It creates the right foundation for AI driven business observability to deliver meaningful, actionable insights that scale with your business.
Unlocking Innovation with VuNet's Business-Centric Observability Platform
VuNet’s Business-Centric Observability Platform is built from the ground up to solve these challenges. Combining the power of big data, business context and AI/ML, it creates a unified architecture that offers clarity, speed and actionability.
Let's explore the core components of VuNet's Business-Centric Observability Platform:
vuSmartMaps™: The Big Data and MLOps Platform
vuSmartMaps™, VuNet’s powerful big data and MLOps platform, ingests, correlates and analyses the massive volumes of data generated by modern IT systems. vuSmartMaps™ provides:
⦁ Real-time processing of observability data at scale
⦁ Correlation across logs, metrics, and traces
⦁ Advanced ML for anomaly detection and proactive insights
⦁ Visualizations tailored to both technical and business users
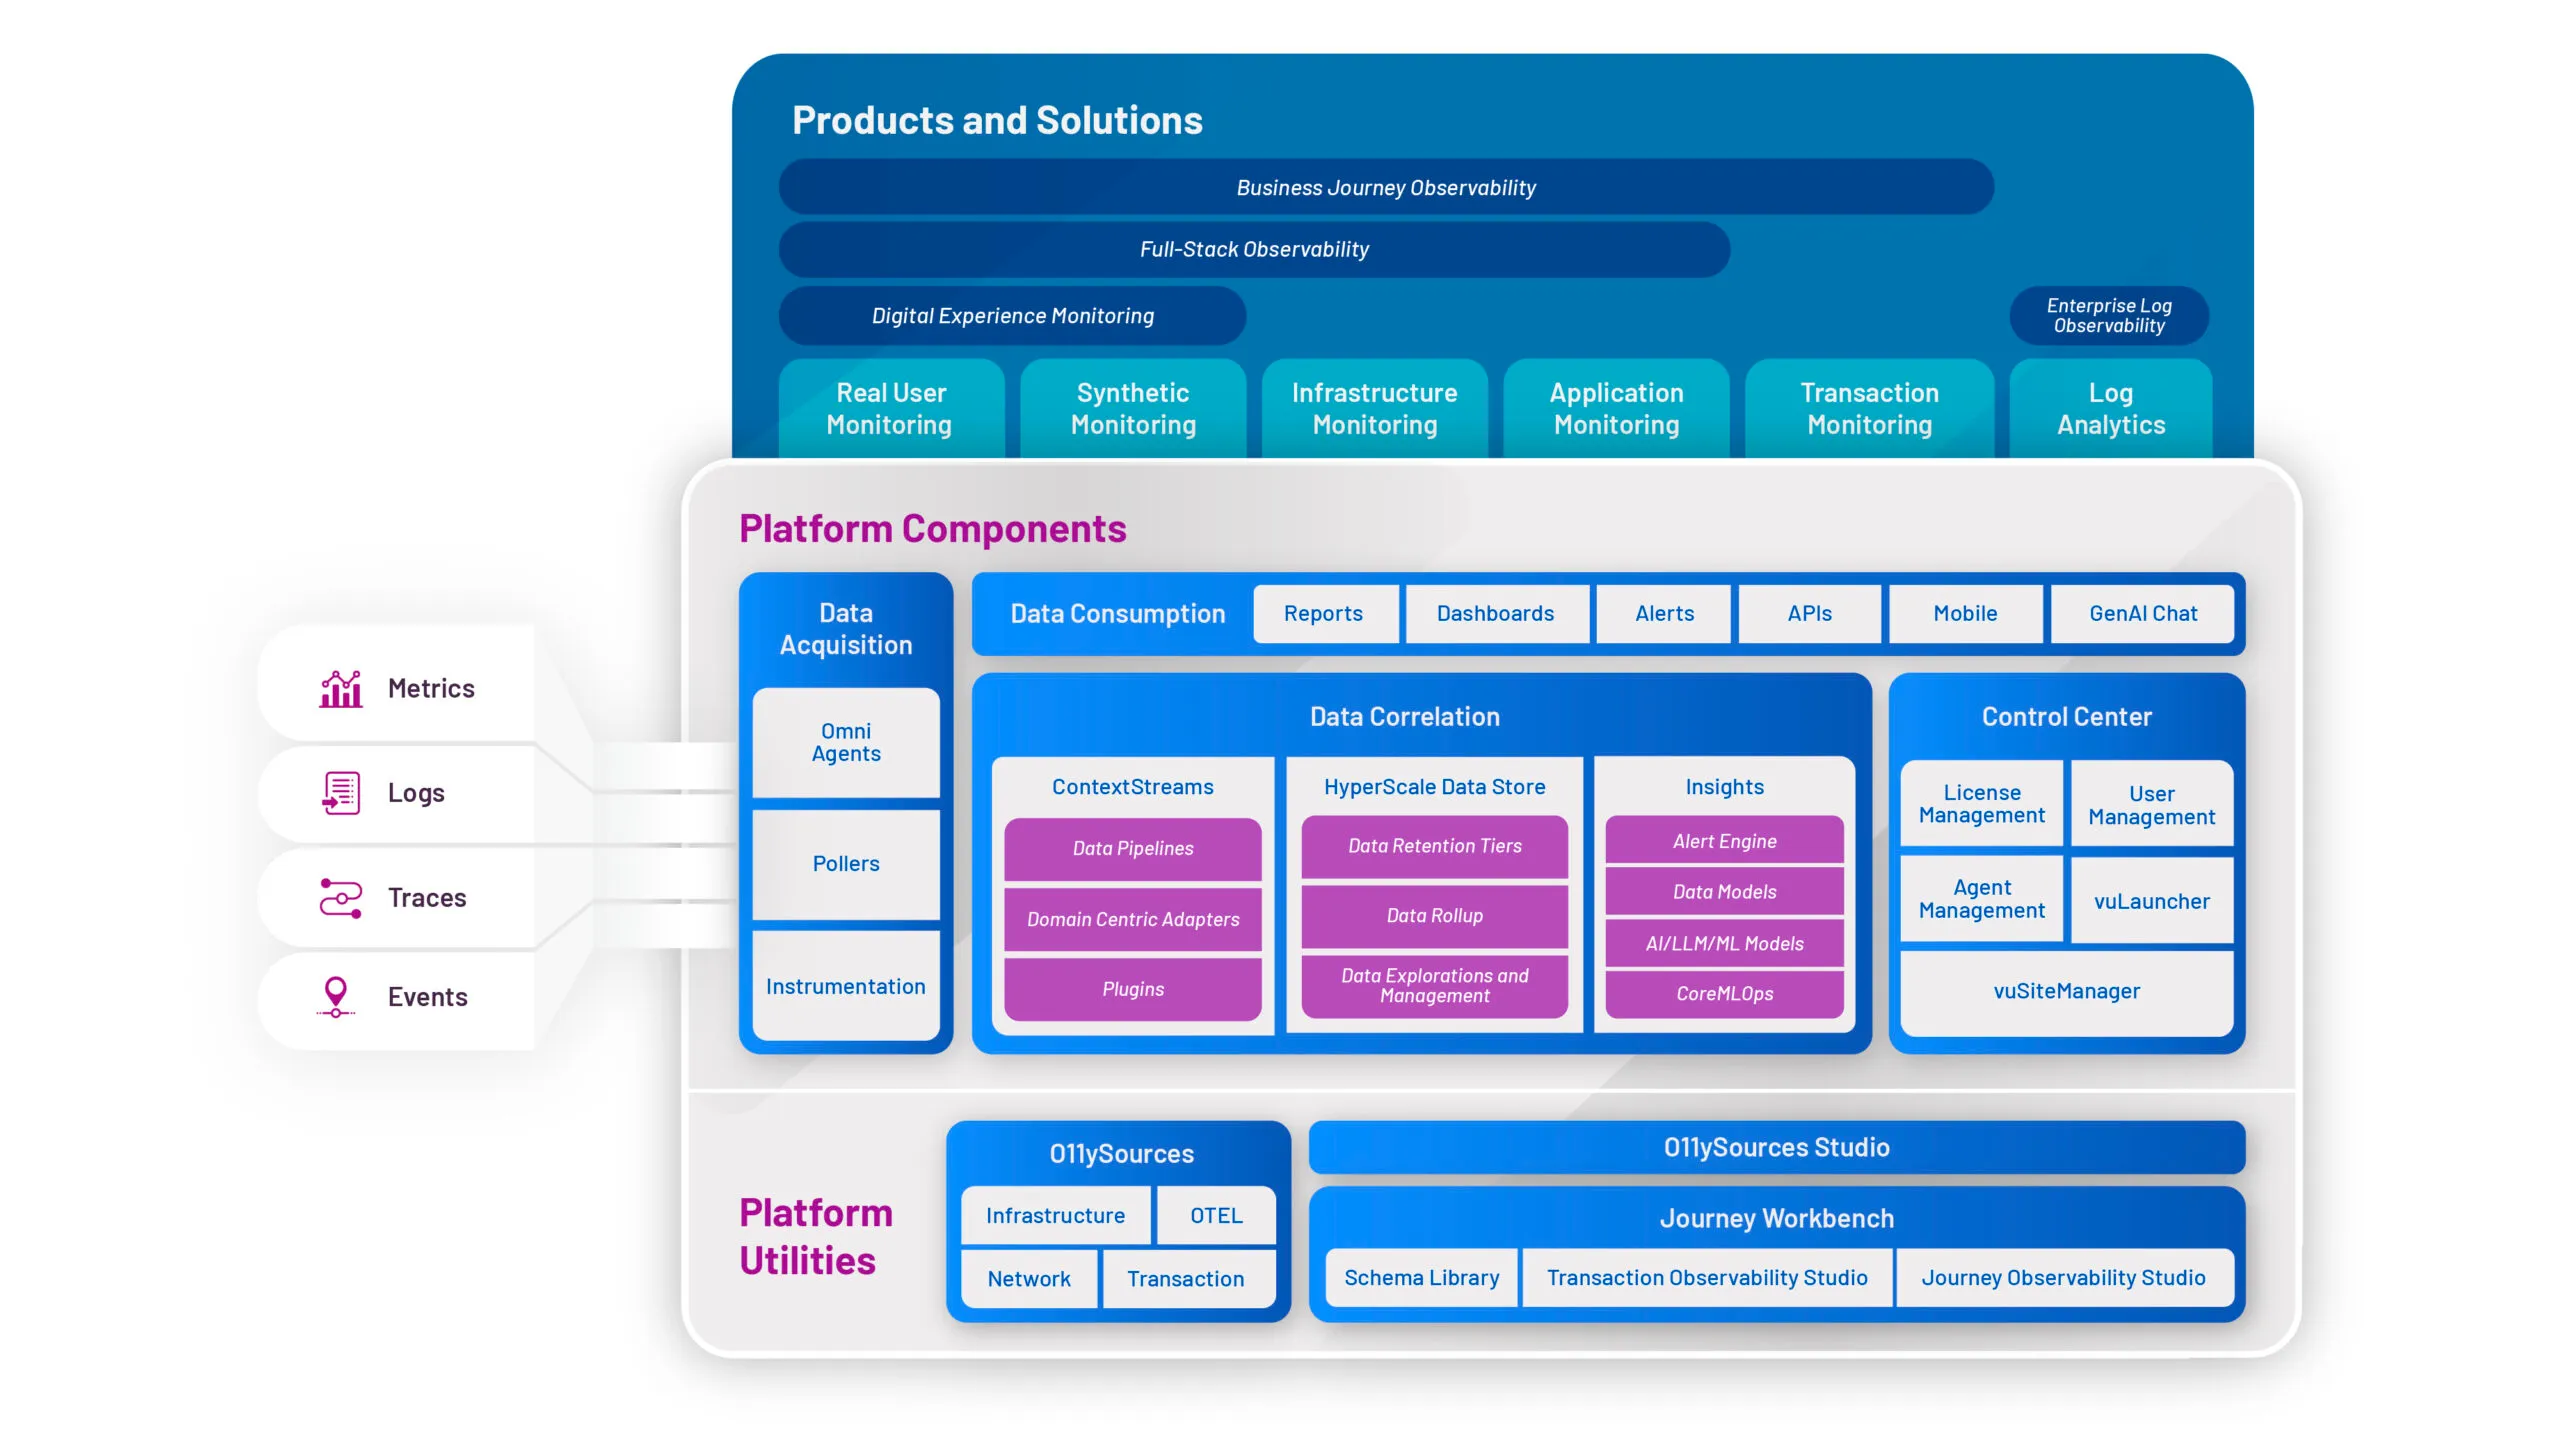
Fig 2: VuNet’s AI/ML and Big Data Platform
Domain-Centric Adaptors: Accelerating Value with Industry Context
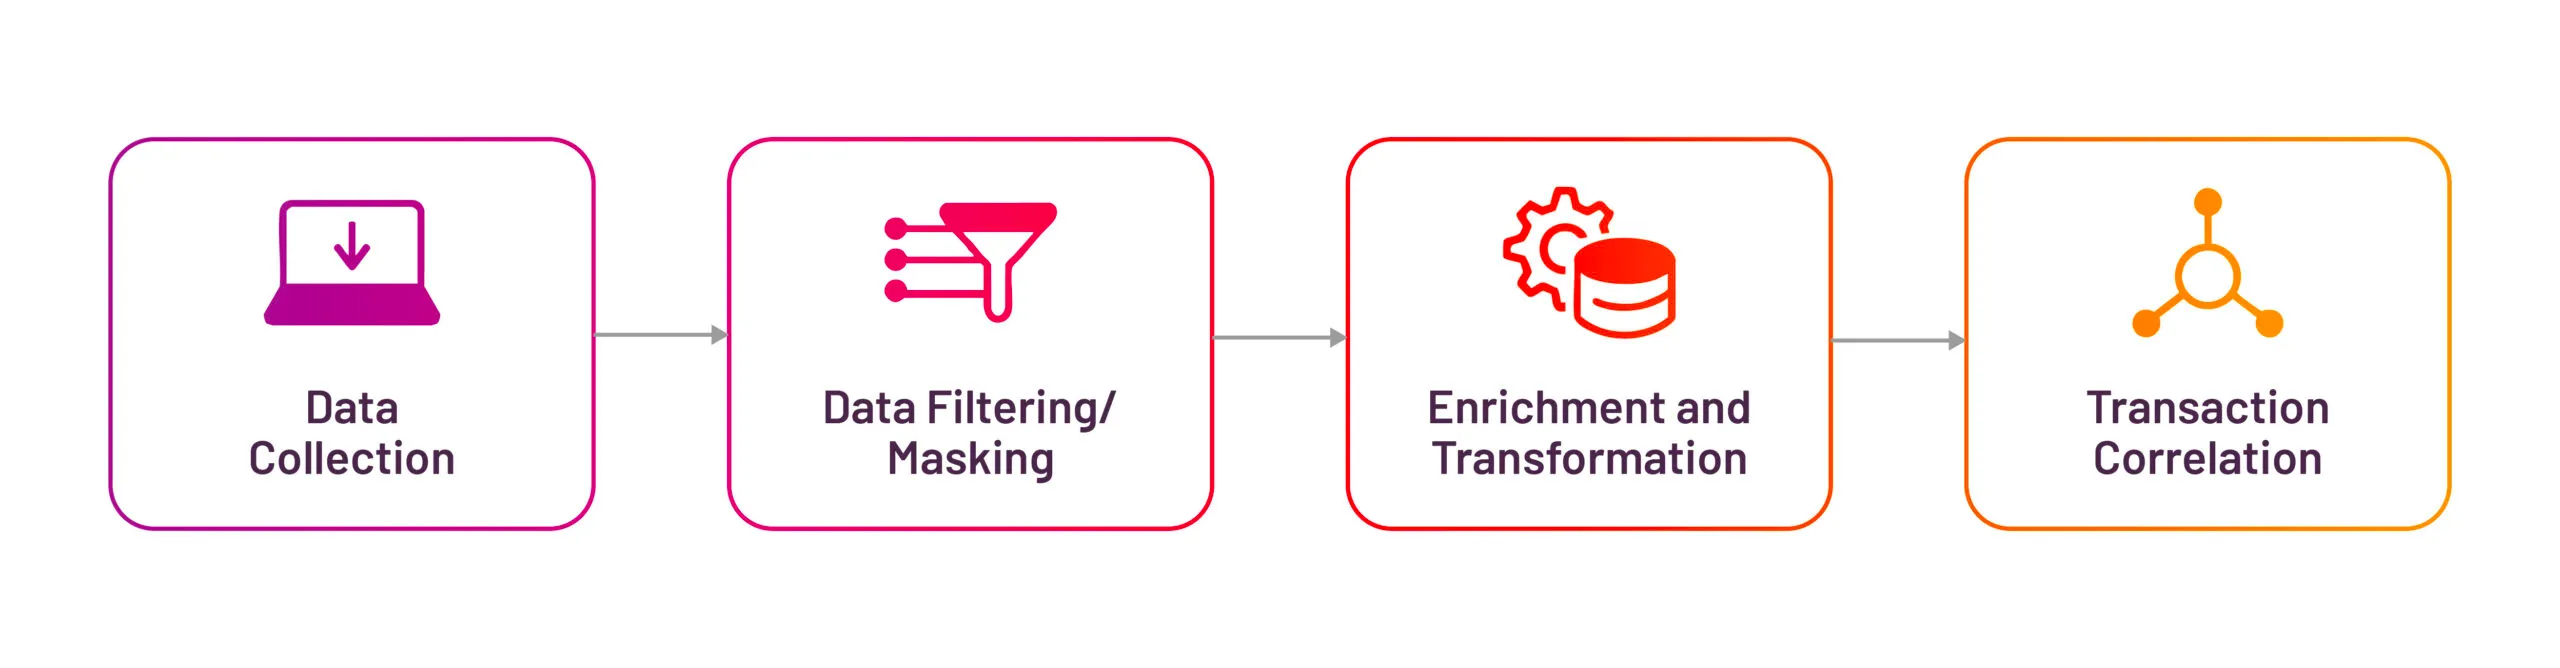
Fig 3: Functioning of vuSmartMaps™’s Domain Centric Adaptors
What sets VuNet apart is its use of domain-centric adaptors — pre-built connectors and integrations designed for specific industries and business domains. These adaptors:
⦁ Seamlessly plug into critical applications, infrastructure, and vendor systems with minimal to no intrusion on client side.
⦁ Interpret domain-specific data and map it into VuNet’s unified data model
⦁ Accelerate onboarding and time-to-value by reducing customization overhead
⦁ Provide out-of-the-box observability tailored for sectors like banking, payments, insurance, and for specific business journeys such as Payments. loan processing, core banking etc.
This domain-aware integration approach ensures that observability is not just technically comprehensive — but business-relevant from day one.
Unified Transaction Schema (UTS): Standardizing Observability Data
The UTS establishes a consistent framework for organizing and understanding all observability data regardless of source. This unified schema:
⦁ Creates a common language for all observability signals
⦁ Enables powerful cross-domain analytics
⦁ Facilitates correlation between technical metrics and business outcomes
⦁ Supports both real-time monitoring and historical analysis
Unified Transaction Map (UTM): Complete Journey Visibility
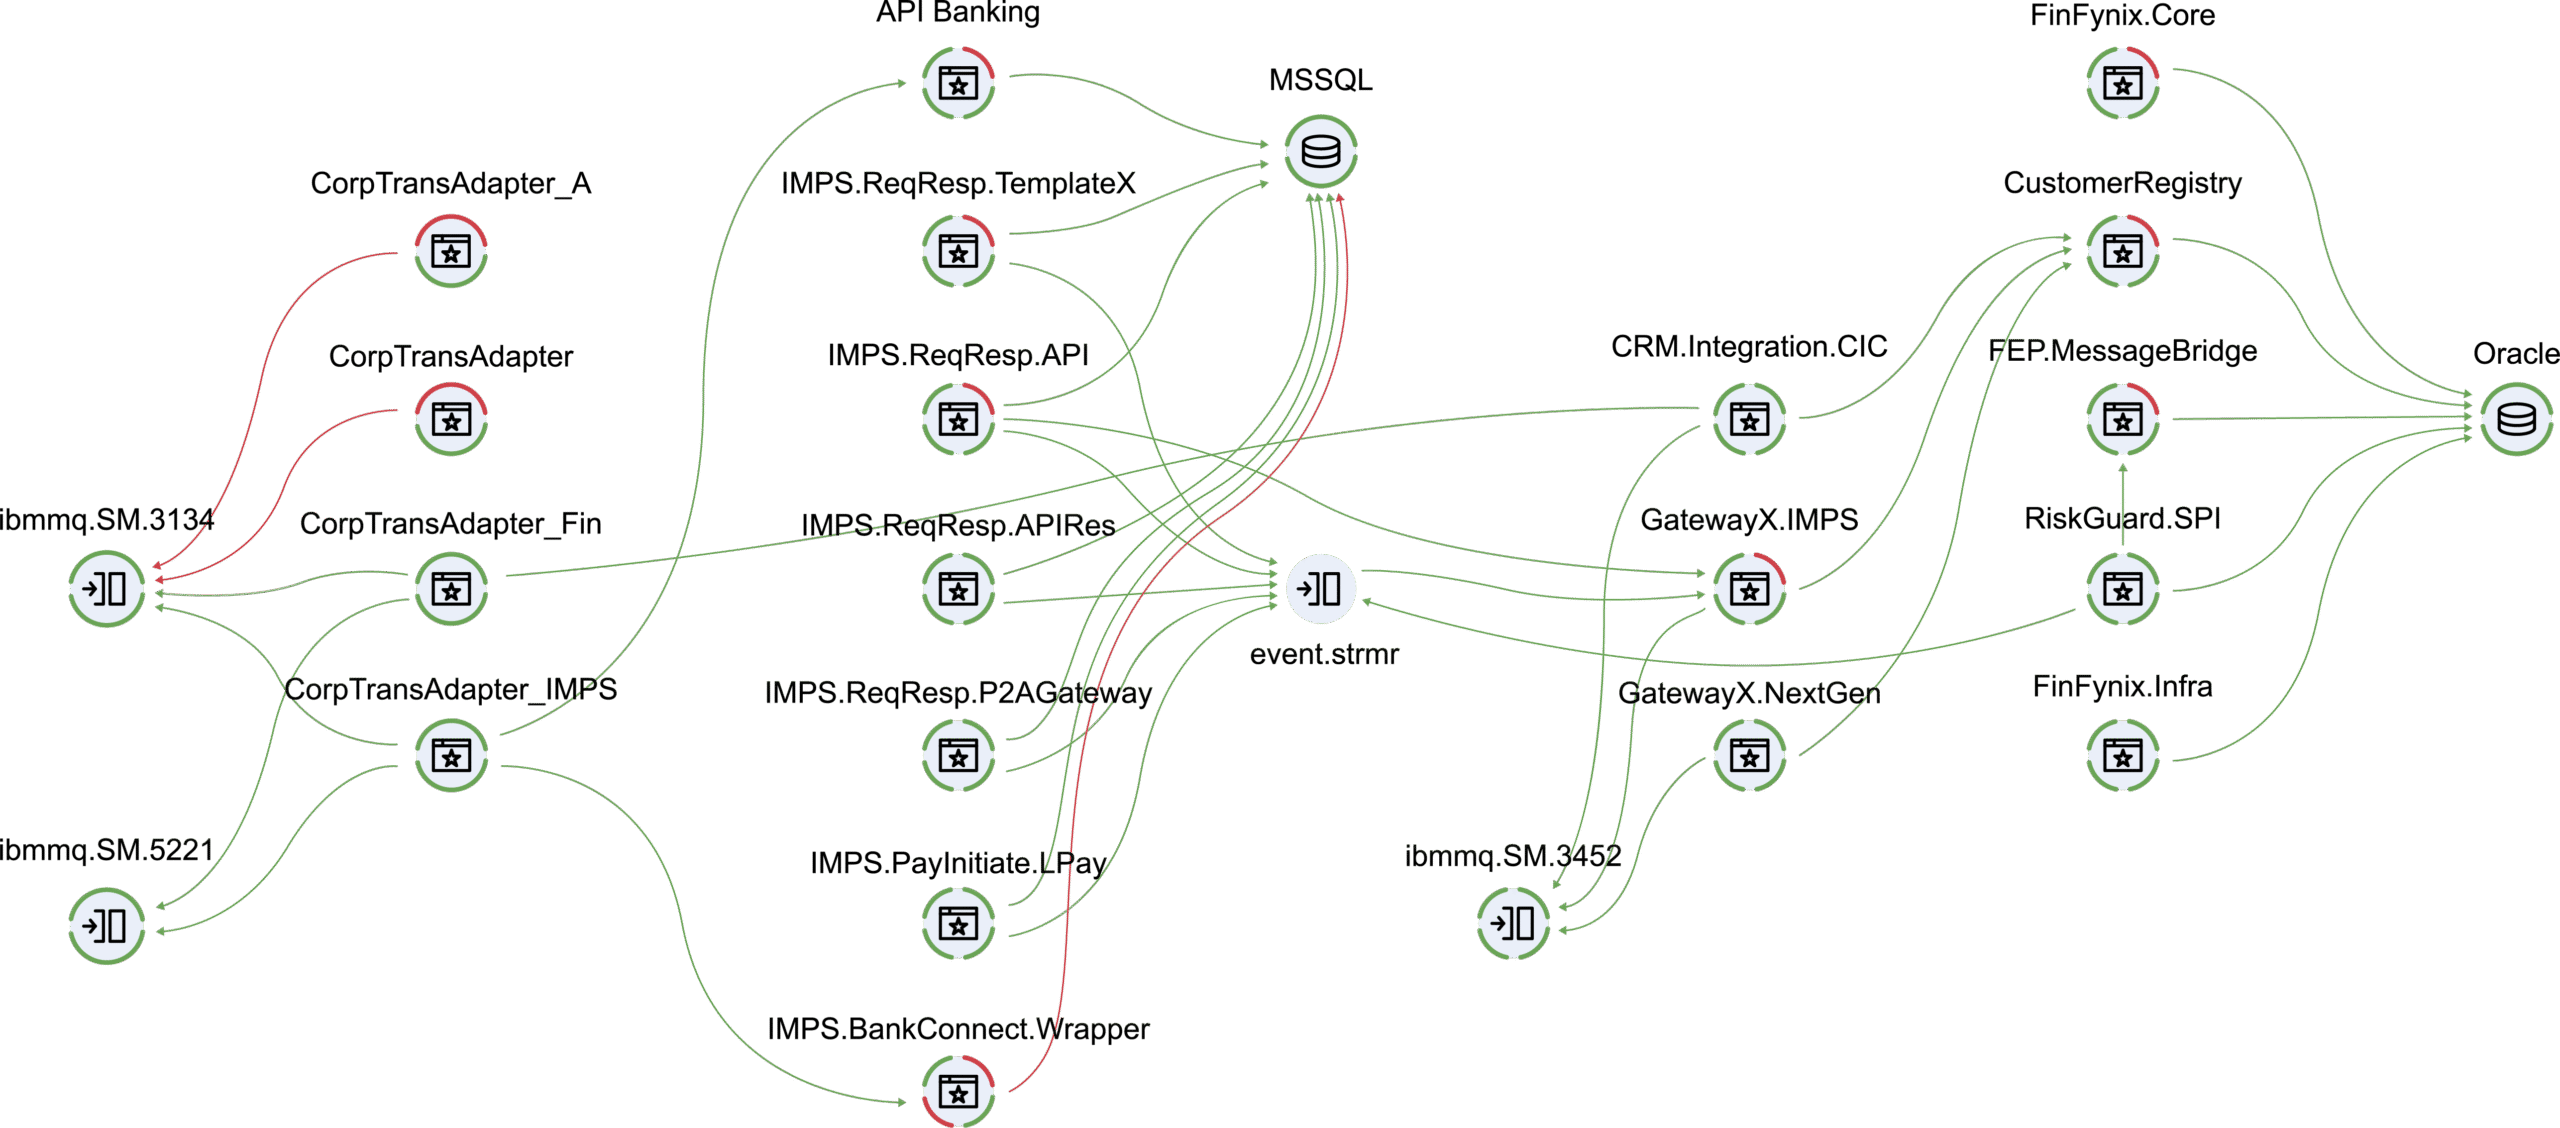
Fig 4: Unified Map of Transactions Representation in vuSmartMaps™
The UTM is a revolutionary capability that constructs a visual representation of transactions as they flow through various systems, applications, APIs, and touchpoints. The UTM:
⦁ Creates a graph-based representation of transaction paths
⦁ Identifies dependencies between services and components
⦁ Provides instant visibility into performance bottlenecks
⦁ Enables root cause analysis through the complete transaction journey
Journey Workbench: Empowering Business and Technical Teams
The Journey Workbench (JWB) puts the power of UTM and UTS in the hands of both technical and business users.
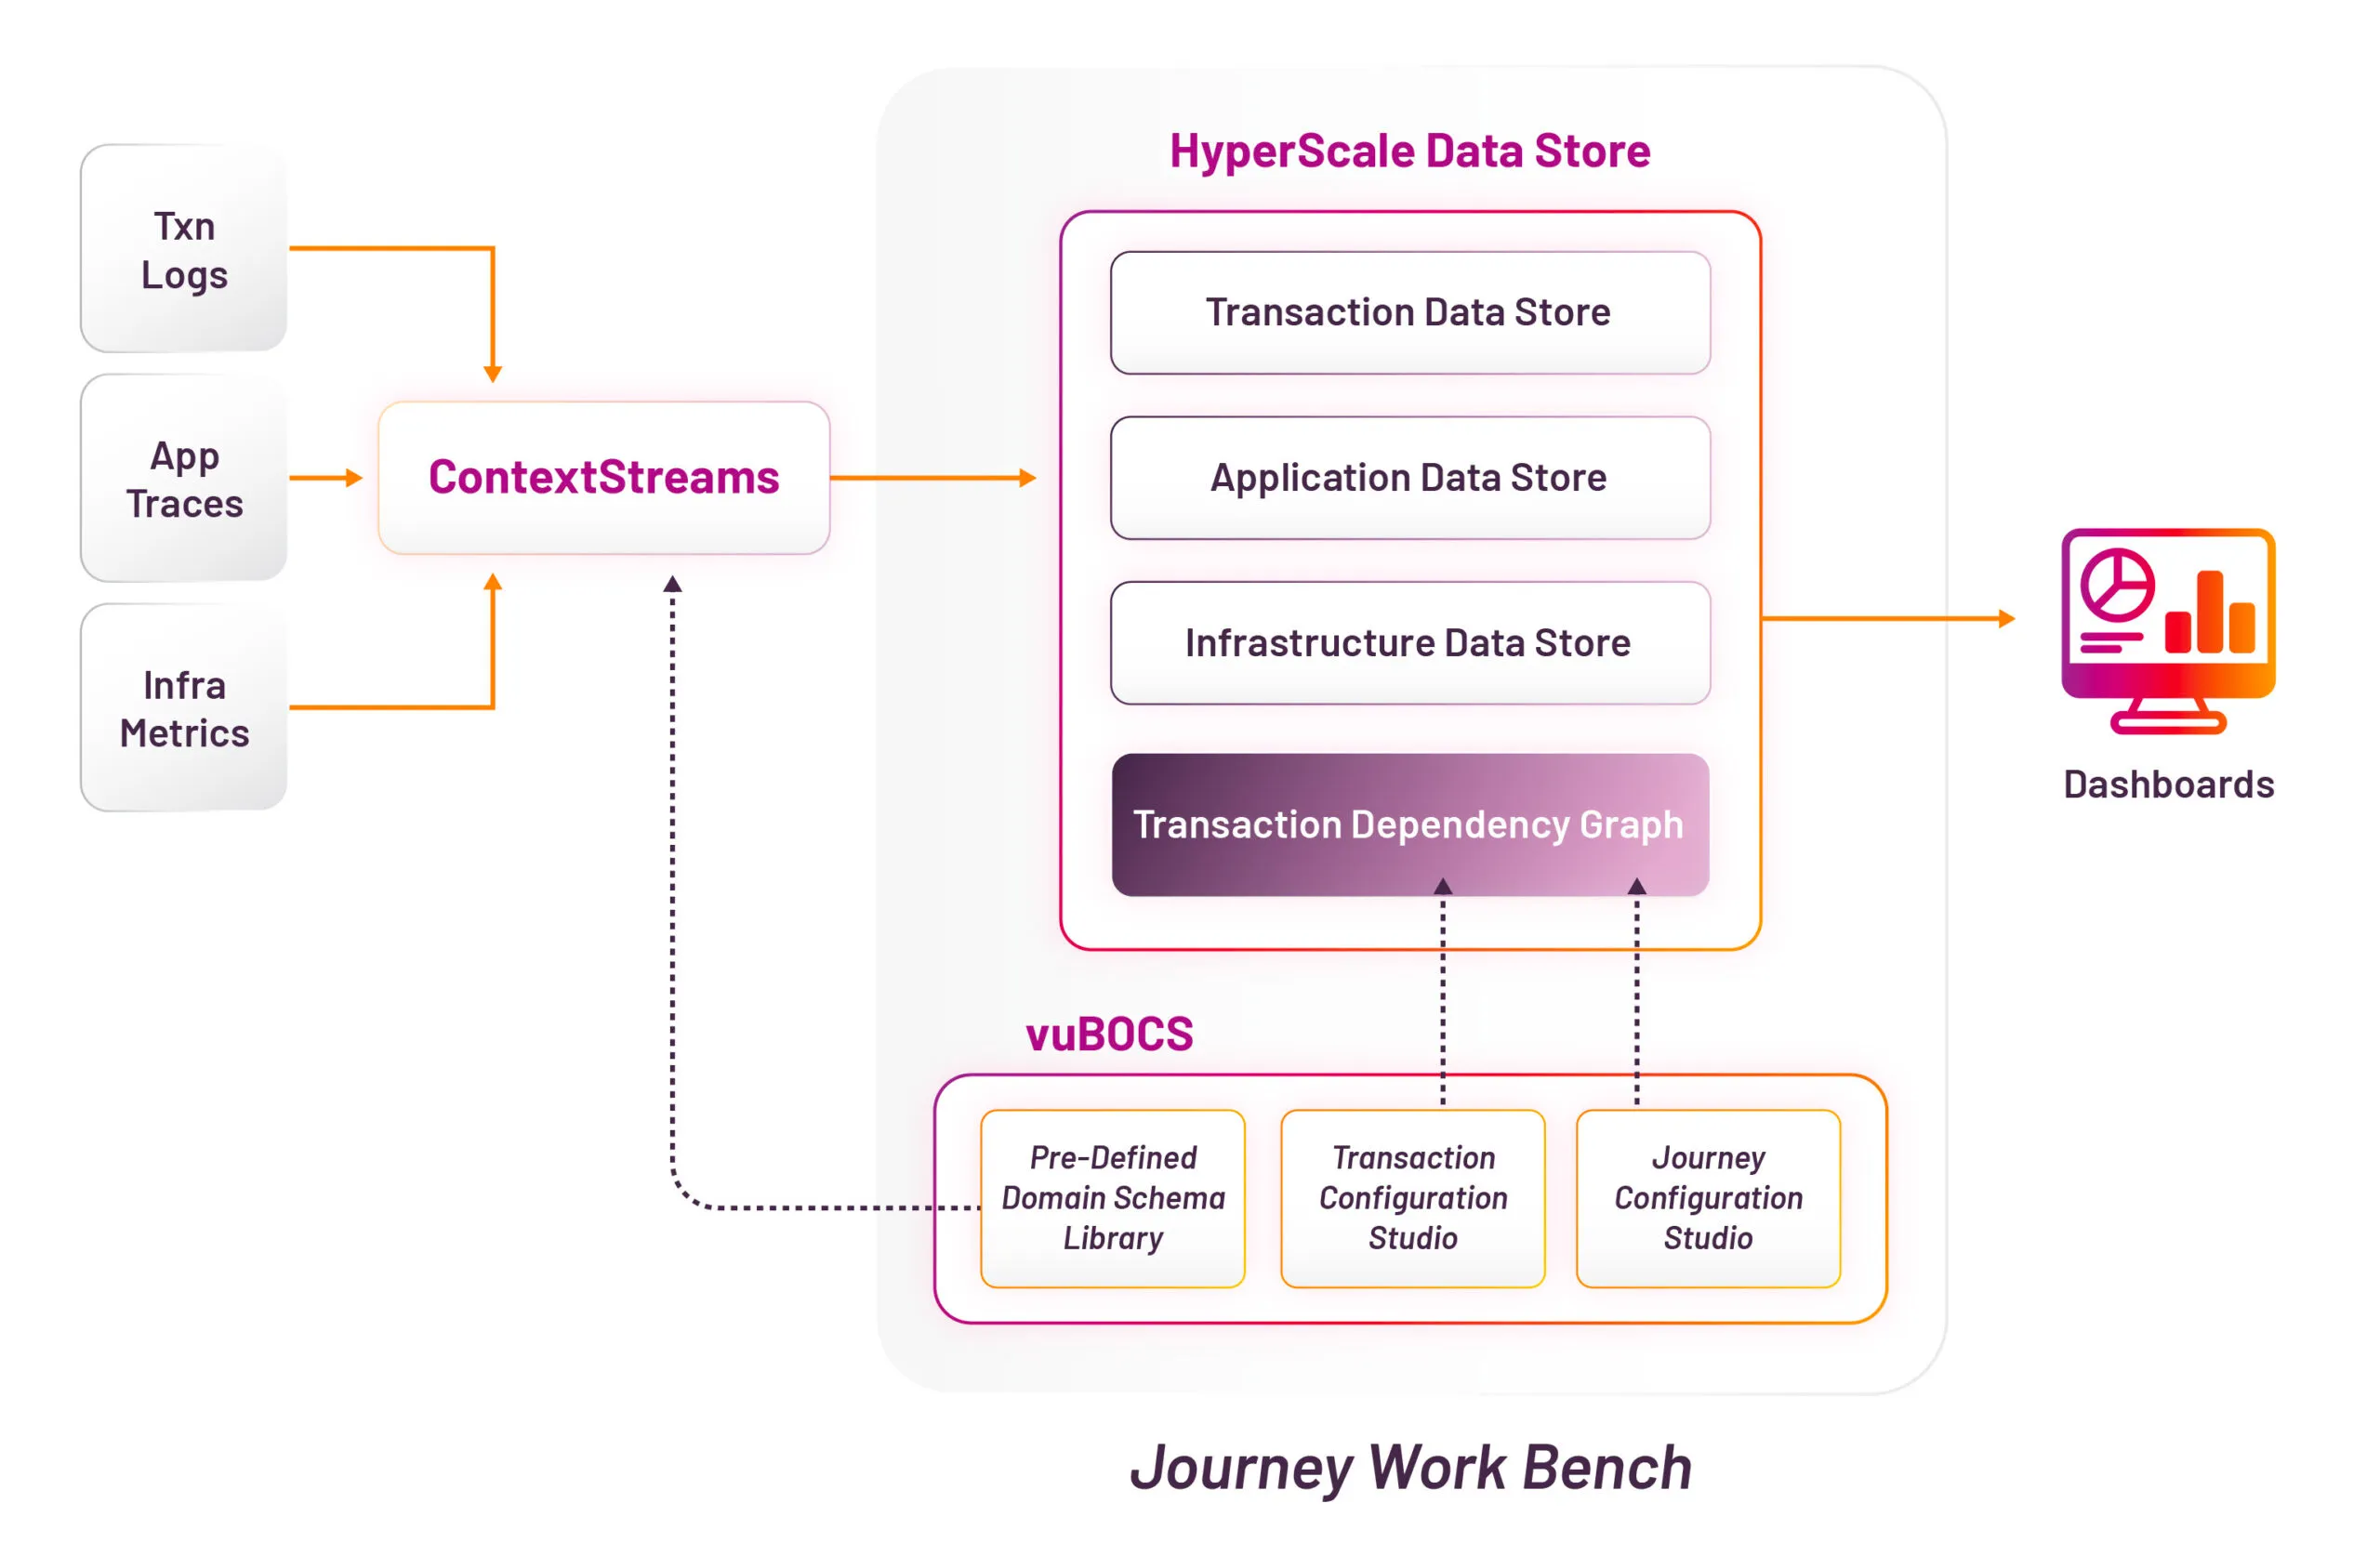
Fig 5: Customization of Transaction Schema and Mapping with JWB
This intuitive interface allows teams to:
⦁ Define and visualize custom business journeys
⦁ Set performance thresholds aligned with business goals
⦁ Create role-specific dashboards and visualizations
⦁ Share insights across the organization
Real-World Impact: From Complexity to Clarity
Fig 6: Single Source of Truth for a Leading Financial Services Provider
Building the Foundation for Future-Ready Innovation
The big winners in the digital economy will not be those with the most tools, but those who understand their operational data — and use it wisely.
Business observability is no longer a luxury — it’s a strategic necessity. And to make it work, enterprises need to start with data, context, and a unified platform that brings it all together.
VuNet’s Business-Centric Observability Platform delivers exactly that. By combining visibility, intelligence, and business alignment into one solution, VuNet is enabling enterprises to take control of their digital future.
Ready to step up your innovation?
Contact VuNet for a free demo and discover how our Business-Centric Observability Platform can transform your operations — and accelerate your journey to a smarter, more resilient future.