Browser Journey Monitoring Dashboards
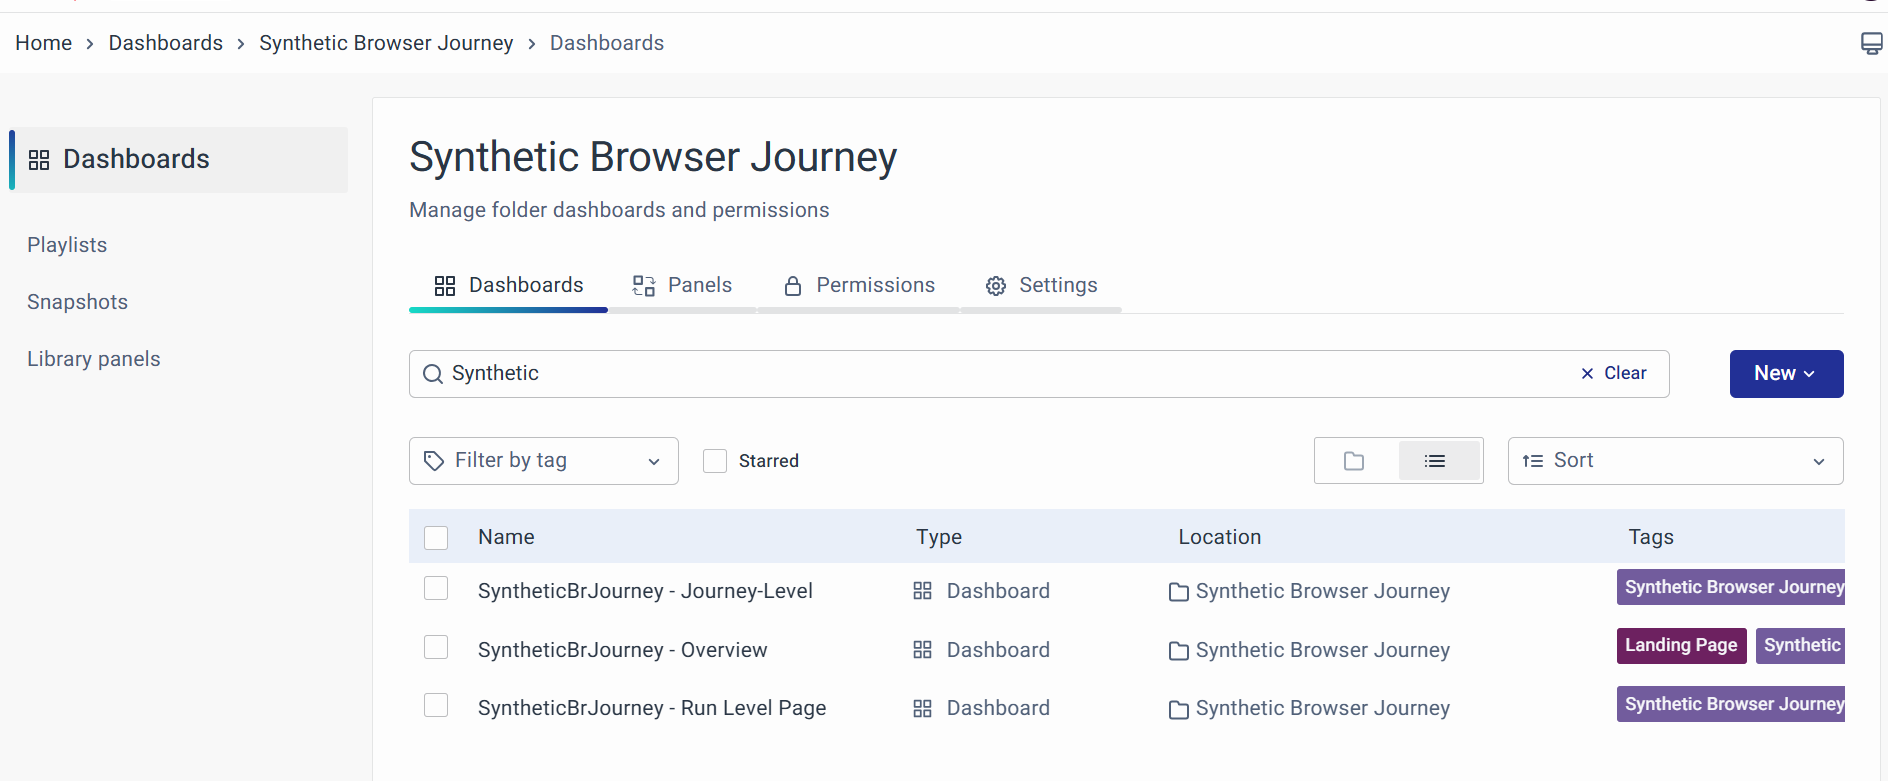
Synthetic Browser Journey Monitoring Dashboards, pre-packaged with Synthetic Browser Journey Monitoring, can be accessed by navigating to the Dashboards UI from the left navigation menu, Dashboards. On the Dashboards landing page, SyntheticBrJourney - Overview can be accessed with the help of the Search bar. The SyntheticBrJourney - Overview dashboard is stored under the Synthetic Browser Journey folder.
Synthetic Browser Journey offers a variety of screens to provide you with valuable insights. Here are the available dashboards:
-
SyntheticBrJourney - Overview Dashboard: The Synthetic Browser Journey Overview Dashboard offers a comprehensive overview of journey metrics, health statuses, execution stats, real-time alerts, and performance data to monitor, troubleshoot, and optimize browser-based workflows.
-
SyntheticBrJourney - Journey-Level Dashboard: The Synthetic Browser Journey - Journey-Level Dashboard provides a real-time overview of workflow performance, tracking status, failure rates, run times, and active alerts while offering detailed logs, screenshots, and visual trends to prioritize and address issues quickly.
-
SyntheticBrJourney - Run Level Dashboard: The Synthetic Browser Journey - Run Level Page dashboard provides a detailed, step-by-step breakdown of test runs, showing run status, execution time, failed steps, and the cause of failures, along with screenshots and logs for quick troubleshooting and issue resolution.
-
Synthetic Browser Journey - Screenshot view Dashboard: The Synthetic Browser Journey - Screenshot view Dashboard displays images from each test step to visually confirm errors, UI behavior, and performance issues.
The dashboard provides an overview of all synthetic browser journeys, their health, performance, and error trends. Each widget displays key metrics to assess the status of synthetic monitoring across multiple journeys.
SyntheticBrJourney - Overview
The Synthetic Browser Journey Overview Dashboard provides a comprehensive overview of synthetic monitoring for browser-based journeys. It features panels that display key metrics, such as the total count of monitored journeys, their health statuses (healthy, unhealthy, or stale), and execution statistics like total runs, success rates, and failures. Additional insights include real-time alerts, detailed error messages, and journey-specific performance data like latency trends, error percentages, and execution durations. This dashboard acts as a centralized tool for monitoring, troubleshooting, and optimizing synthetic journeys, ensuring system reliability and performance.
SyntheticBrJourney - Overview Panels
Total Journeys

Displays the total count of synthetic browser journeys being monitored. It provides a high-level view of how many journeys are part of the monitoring system.
- Purpose:
- Gives an overview of the total monitoring coverage.
- Acts as a starting point to analyze the health of all monitored journeys.
- Additional Notes:
- This number includes journeys in all statuses (healthy, unhealthy, or stale).
- It's a cumulative representation and doesn't reflect individual status breakdowns.
Healthy Journeys
Shows the number of journeys that are running as expected without errors or performance degradation.
- Purpose:
- Indicates the number of journeys that are functioning optimally.
- Helps teams identify which journeys do not require immediate action.
- Key Attributes:
- A journey is classified as healthy if it has no critical alerts or errors.
- Performance thresholds (e.g., acceptable latency or success rate) must be met for a journey to be considered healthy.
- Troubleshooting Tips: If a journey count unexpectedly drops here, check the Unhealthy Journeys or Alert Insights widgets for possible issues.
Unhealthy Journeys
Displays the number of journeys that are experiencing critical issues, errors, or performance degradation.
- Purpose:
- Alerts users to the journeys that need immediate attention.
- Acts as an entry point for troubleshooting.
- Key Attributes:
- A journey is deemed unhealthy if it has critical alerts, errors, or significant latency issues.
- The count here directly correlates with active alerts and failures.
- Actionable Steps:
- Use the Error Messages or Alert Insights widget to investigate further.
- Look for recurring issues in the Error % Trend widget to identify patterns.
Stale
Represents the number of journeys that haven’t been executed within a predefined time window (e.g., 12 hours or 24 hours).
- Purpose:
- Identifies journeys that are no longer being actively tested.
- Flags potential configuration or scheduling issues.
- Key Attributes:
- A stale journey might indicate a problem with the execution schedule or the monitoring system itself.
- Stale status does not necessarily imply errors but warrants investigation.
- Troubleshooting Steps:
- Verify the execution schedule for stale journeys.
- Check system logs to identify possible issues with the monitoring pipeline.
Total Runs
Tracks the total number of synthetic test executions across all journeys over a selected time period.
- Purpose:
- Provides insights into the volume of synthetic monitoring activity.
- Helps gauge system reliability and the frequency of executions.
- Additional Notes:
- Total runs include all executions, regardless of success or failure.
- High run counts may indicate rigorous monitoring but could also point to redundant executions.
Success Runs
Counts the number of successful synthetic test executions.
- Purpose:
- Indicates system reliability and the percentage of tests completed without errors.
- Serves as a benchmark to measure against failed or in-progress runs.
- Troubleshooting Steps:
- If the success count is low, investigate the Failed Runs or Error Messages widgets.
- Compare success rates against historical data to identify anomalies.
Failed Runs
Shows the number of synthetic test executions that encountered errors or critical issues.
- Purpose:
- Highlights the volume of failures that occurred during monitoring.
- Helps pinpoint periods or journeys with the most issues.
- Actionable Steps:
- Use the Error Messages widget to identify specific error codes and their frequency.
- Investigate journey configurations and dependencies for the affected tests.
In-Progress Runs
Represents the number of synthetic test executions currently running.
- Purpose:
- Helps monitor real-time test activity.
- Identifies whether the system is actively executing tests or encountering scheduling delays.
- Additional Notes:
- A consistently high number of in-progress runs might indicate slower test execution or system bottlenecks.
- Check system performance metrics if runs remain in progress for an extended period.
Alert Insights
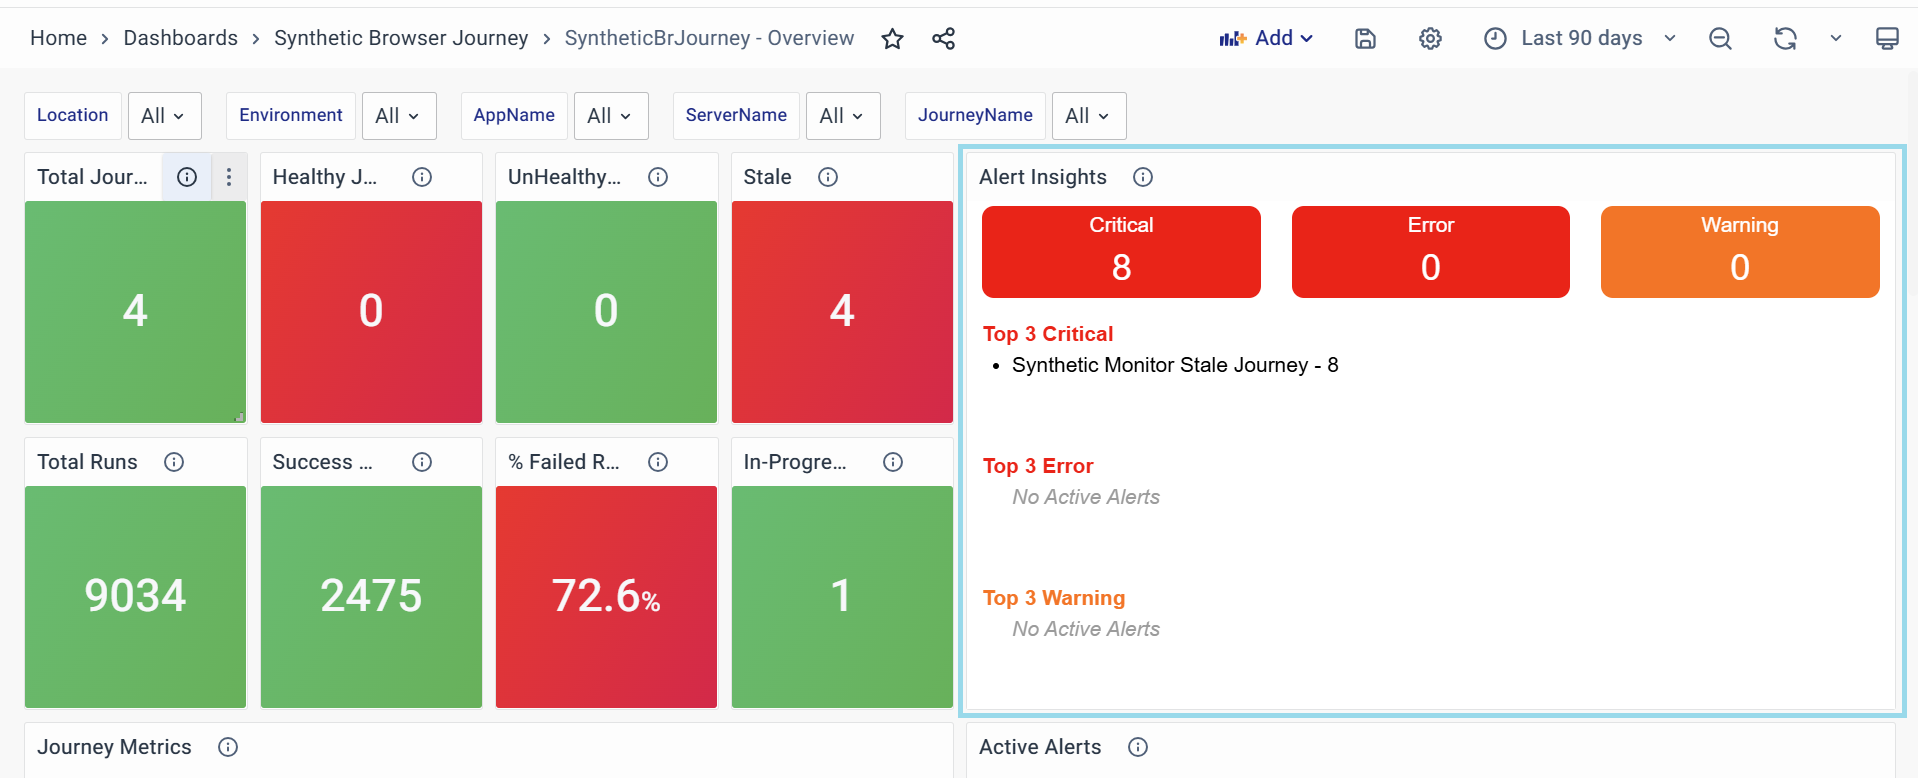
Represents the count of all alerts, categorized into critical alerts, warnings, and errors.
- Purpose:
- Provides a quick overview of the system's alert status.
- Highlights the most significant issues through the top 3 critical alerts, errors, and warnings.
- Additional Notes:
- Monitoring top critical alerts helps prioritize urgent fixes.
- Frequent occurrences of specific errors or warnings may indicate recurring issues requiring deeper investigation.
Journey Metrics
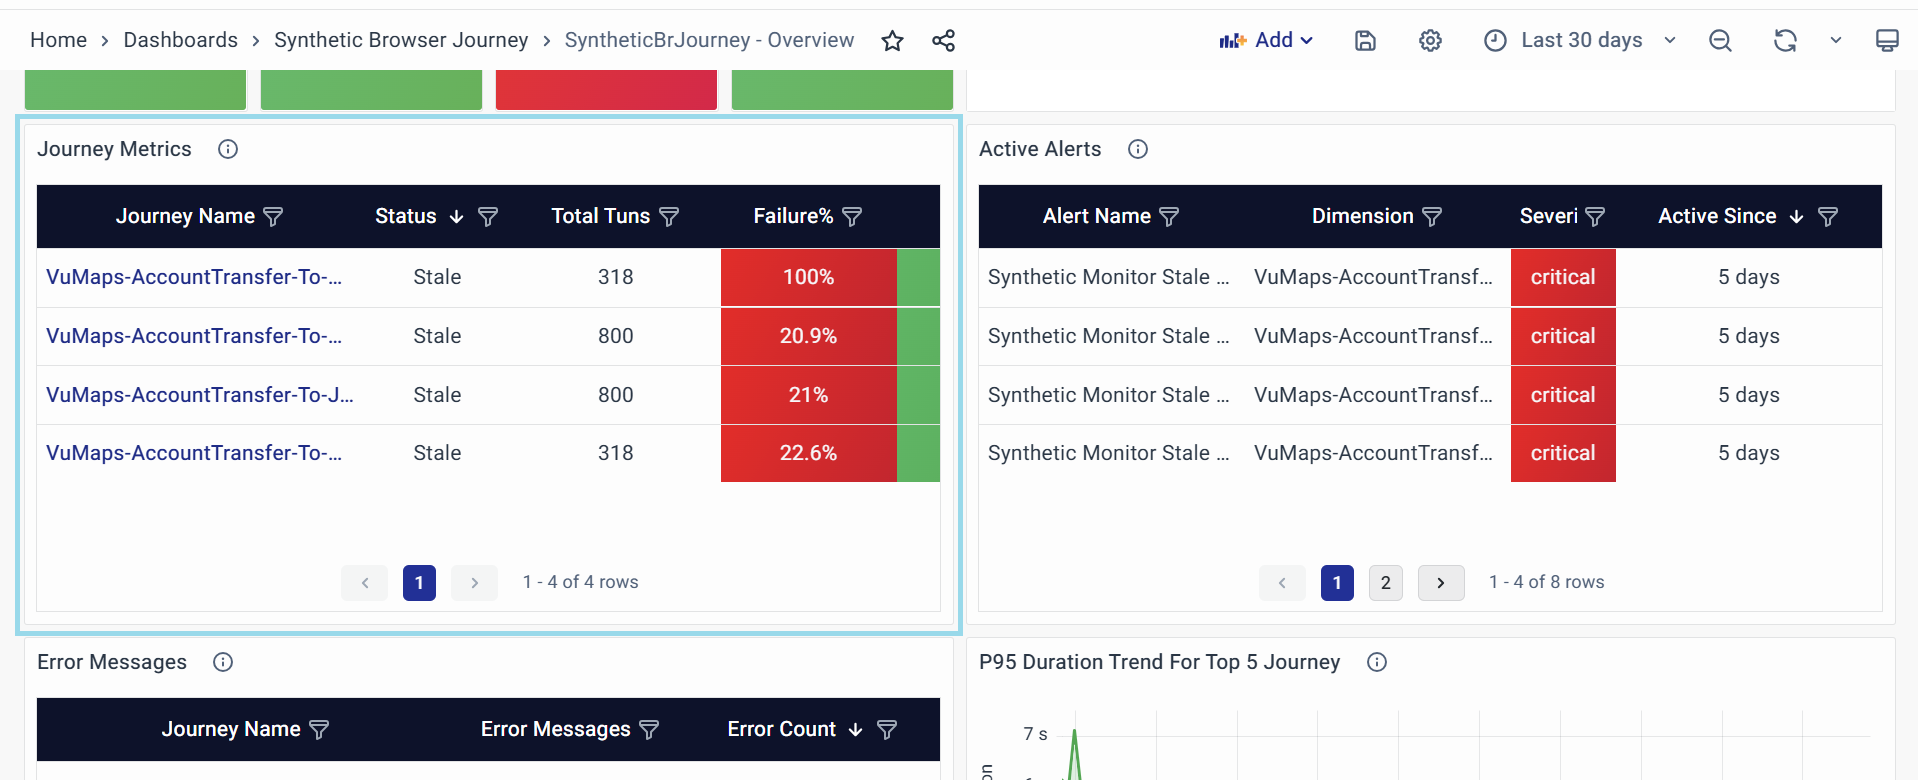
The "Journey Metrics" table widget provides detailed performance data and health status for each monitored synthetic browser journey. It allows users to analyze individual journey behaviors and identify specific issues or trends.
-
Journey Name
- The name of the synthetic journey being monitored.
- Purpose:
- Identifies each journey uniquely.
- Enables users to focus on specific journeys for further analysis.
-
Actions: Click on a journey name to access the Synthetic Browser Journey - Journey-Level Dashboard for detailed insights.
-
Status
- Indicates the current health status of the journey (e.g., Stable, Unstable, Stale).
- Purpose:
- Highlights whether the journey is running as expected.
- Helps users quickly spot problematic journeys.
- Common Values:
- Stable: The journey is operating without significant issues.
- Stale: The journey has not been executed in the expected time window.
- Unstable: The journey is experiencing errors or failures.
-
Total Runs
- The total number of executions for the journey in the selected time.
- Purpose:
- Provides insights into how frequently the journey is being executed.
- Helps determine if the execution schedule is consistent.
- Analysis Tips: Low run counts could indicate misconfigurations or missed executions.
-
Failure%
- The percentage of executions that resulted in errors for the journey.
- Purpose:
- Indicates the reliability of the journey.
- A high error percentage signals potential issues with the application or synthetic test configuration.
- Actionable Steps: Investigate high error percentages by cross-referencing with the Error Messages widget.
-
Duration (s)
- The average duration (in seconds) taken for each run of the journey.
- Purpose:
- Provides insights into journey performance and execution time.
- Helps identify potential performance bottlenecks.
- Analysis Tips: Sudden spikes or trends in duration may indicate backend performance issues or application delays.
-
Time Since Last Run
- The time elapsed since the journey was last executed.
- Purpose:
- Highlights gaps in monitoring or execution delays.
- Identifies stale journeys quickly.
- Actionable Steps: For stale journeys, review the execution schedule or monitoring configuration.
-
Purpose of the Table: It provides a granular view of each journey's health, reliability, and performance metrics, acting as a diagnostic tool to identify issues at the journey level and helping prioritize journeys for troubleshooting based on their status, error rates, or execution delays.
-
Usage Tips: Use column filters or sorting to prioritize critical journeys, such as those with the highest error percentage or the shortest time since the last run. Combine insights from this widget with others, like Error Messages or Alert Insights, to drill down into specific issues.
Active Alerts
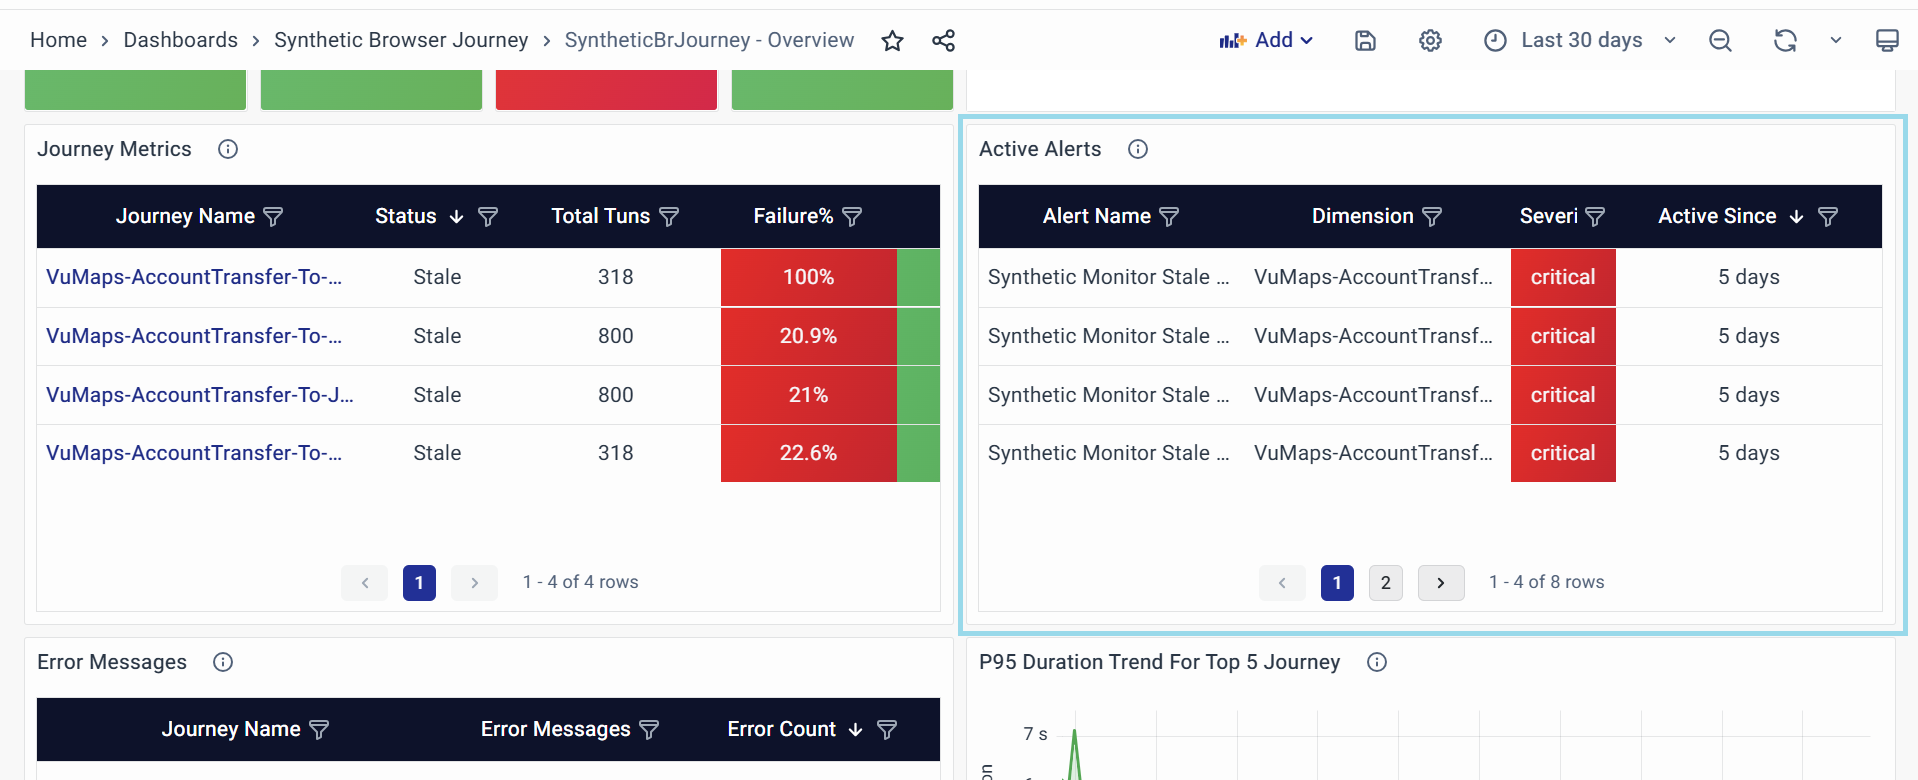
The "Active Alerts" panel provides real-time notifications about ongoing issues or events, enabling quick responses to critical situations.
-
Alert Name
- The specific identifier of the triggered alert.
- Purpose:
- Uniquely identifies the type or category of the alert.
- Allows users to differentiate and prioritize alerts based on known issues.
-
Dimension
- The component, service, or user journey is affected by the alert.
- Purpose:
- Specifies the impacted area of the application or infrastructure.
- Focuses troubleshooting efforts on the relevant context.
- Analysis Tips: Cross-reference with other dashboards to correlate alerts with performance trends.
-
Severity
- The urgency level of the alert.
- Purpose:
- Indicates the potential impact of the issue.
- Guides prioritization of response efforts.
- Actionable Steps: Filter alerts by severity to prioritize critical issues for escalation.
-
Active Since
- The duration of the alert has remained unresolved.
- Purpose:
- Highlights how long the issue has persisted.
- Identifies stale alerts requiring manual intervention.
- Analysis Tips: Investigate alerts active for extended periods for recurring failures or misconfigurations.
-
Purpose of the Panel: This panel centralizes real-time issue monitoring, streamlining incident response by surfacing critical alerts with context and urgency to minimize downtime.
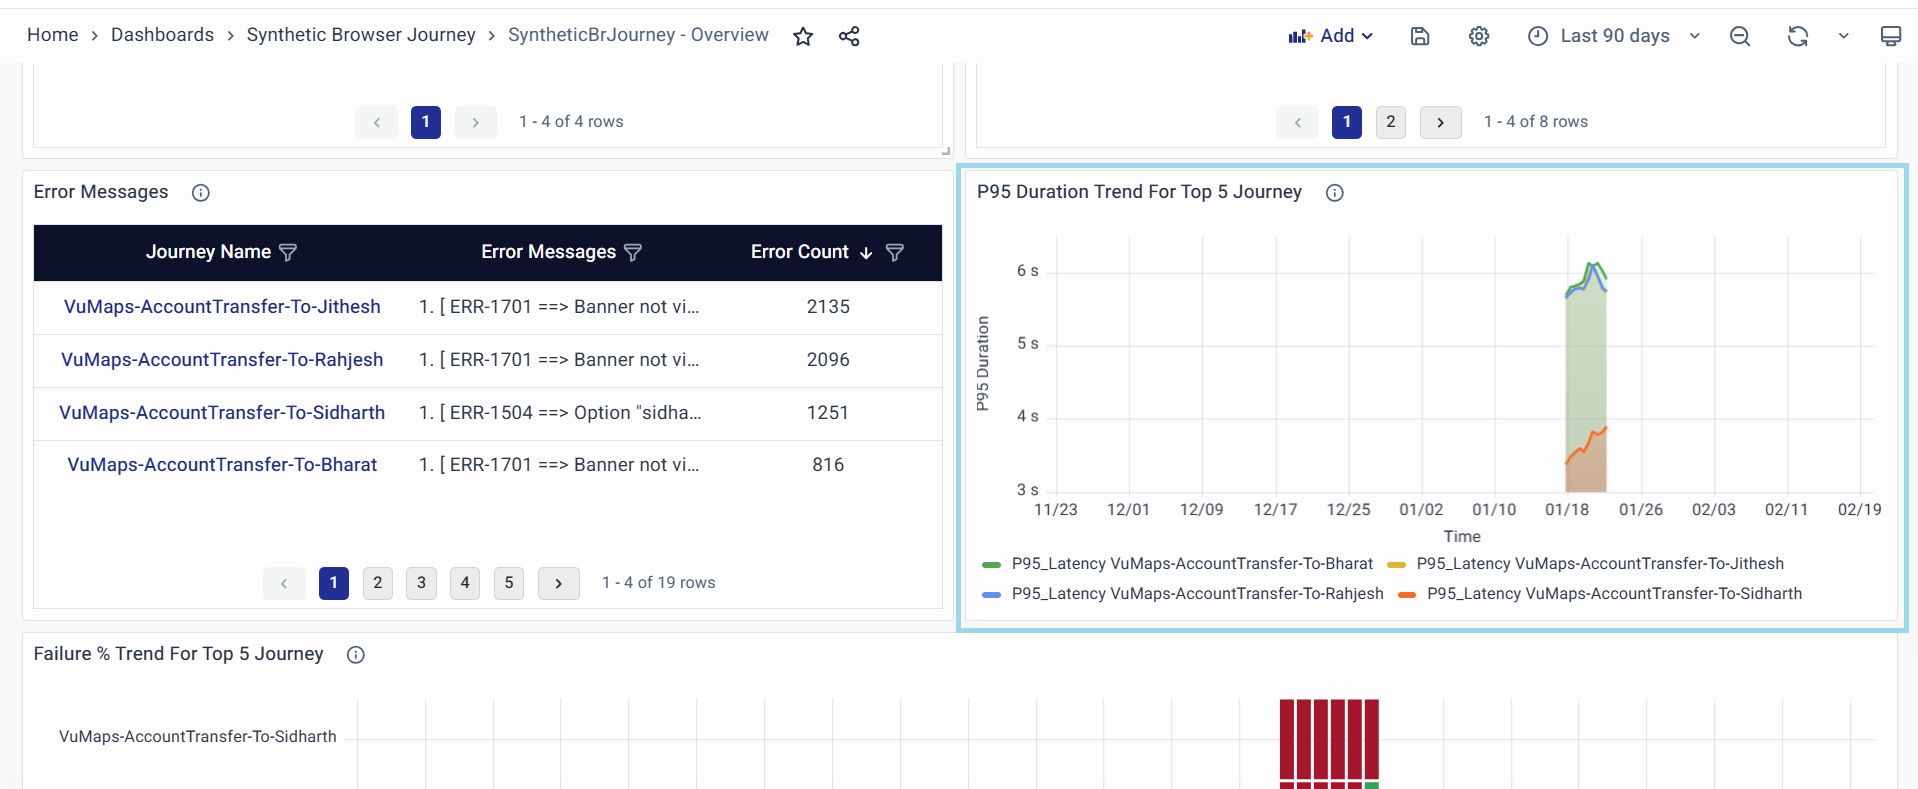
Error Messages

The "Error Messages" widget provides a detailed summary of errors encountered during the execution of synthetic browser journeys. This widget is essential for identifying and analyzing specific error patterns, aiding in troubleshooting and resolution.
-
Journey Name
- The name of the journey where the errors were encountered.
- Purpose:
- Identifies which synthetic journey is affected by the errors.
- Helps in isolating problem areas for focused troubleshooting.
- Actions: Click on a journey name to access the Synthetic Browser Journey - Journey-Level Dashboard for detailed insights.
-
Error Count
- The total number of error occurrences for the specific journey.
- Purpose:
- Quantifies the extent of issues affecting each journey.
- Helps prioritize journeys with the highest error counts for immediate attention.
- Analysis Tips: A consistently high error count for a journey indicates recurring issues that need resolution.
-
Error Messages
- Detailed descriptions of the errors encountered, often including error codes, descriptions, and additional context.
- Purpose:
- Provides specific insights into what went wrong during the journey execution.
- Helps developers and administrators pinpoint the root causes of issues.
- Format:
- Error Code: Unique identifier for the error
- Description: A brief message explaining the error (e.g., "Option 'Siddhartha' not found in the dropdown").
- Contextual Details: Additional information or error stack details (e.g., "Timeout or unexpected banner state").
- Actions:
- Use error codes to cross-reference logs, documentation, or application configurations.
- Look for patterns in error messages to identify recurring issues or systemic problems.
-
Purpose of the Widget: It offers actionable insights into the types and frequency of errors affecting synthetic browser journeys, serving as a diagnostic tool to identify recurring issues or one-off anomalies and enabling the prioritization of debugging efforts based on error frequency and severity.
-
Usage Tips: Sort by Error Count to prioritize journeys with the most errors or by Journey Name to focus on specific journeys. Use column filters to isolate specific error types or journeys, and search for error codes to investigate individual issues. Combine insights from this widget with the Journey Metrics widget to correlate high error counts with other metrics, such as error percentage or execution duration.
-
Example Use Case: When a high number of errors is observed for the journey "VuMaps-AccountTransfer," start by analyzing the error messages column to identify recurring issues, such as "Option 'Sam' not found in dropdown." Verify the dropdown options by checking associated logs or application configurations to ensure they are correctly set up. Additionally, investigate upstream or downstream dependencies that could be contributing to the errors. Resolving the dropdown configuration issue should help reduce the error counts for this journey.
P95 Latency Trend For Top 5 Journey
The P95 Latency Trend widget provides a visualization of the 95th percentile latency for the top 5 synthetic browser journeys. This helps in identifying trends and outliers in response times, ensuring optimal performance and user experience.
-
Key Features:
- Displays the 95th percentile latency (P95) over time for multiple journeys.
- Highlights outliers and trends using a color-coded legend.
- Provides insights into peak latency occurrences and potential bottlenecks.
- Interactive visualization for detailed analysis.
-
Graph Components:
-
Title: The "P95 Latency Trend for Top 5 Journey" provides a quick understanding of the latency trends for the top five journeys, highlighting the 95th percentile latency to identify potential performance bottlenecks or outliers affecting user experience.
-
Legend: Different journeys are distinguished by unique colors, and clicking on a legend item toggles the visibility of the respective data series, allowing for customized analysis.
-
X-Axis (Time): Represents the time of day, showing when the latency data was recorded.
-
Y-Axis (P95 Latency): Measures latency in seconds, helping assess whether the journey latency is within acceptable limits.
-
Data Points and Trends: Each colored dot represents a recorded P95 latency value for a specific journey at a given time, while shaded areas indicate variability or confidence intervals. Sharp spikes highlight anomalies that may require further investigation.
- Interpretation Guidelines:
- Stable Trend: If the latency line remains flat with minimal fluctuations, the journey performance is consistent.
- Gradual Increase: Indicates a potential degradation over time, which may require scaling or optimizations.
- Sudden Spikes: Often signify transient issues, network slowdowns, or resource contention.
- Clustered Drops: Possible system recoveries or optimizations applied.
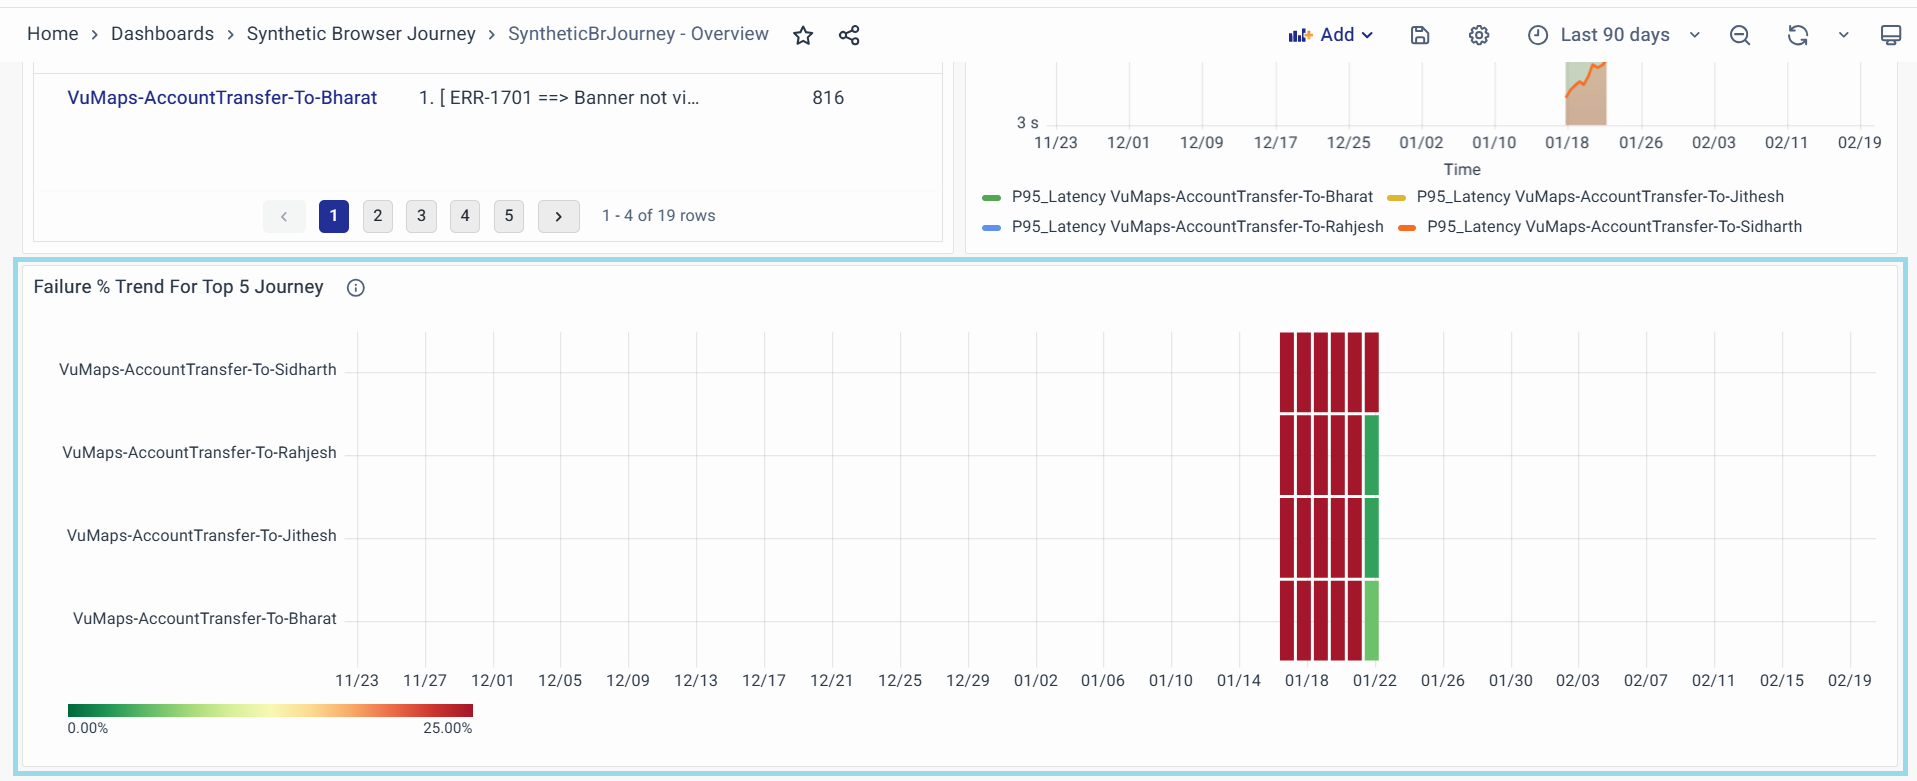
Failure % Trend For Top 5 Journey
The Error % Trend widget provides a visual representation of the error percentage across the top 5 synthetic browser journeys over time. This helps in identifying periods of high failure rates and understanding journey reliability trends.
-
Key Features
- Tracks error percentages across different journeys.
- Provides a timeline-based view to detect patterns and recurring issues.
- Uses a color gradient scale to indicate error severity from 0% to 100%.
- Helps in diagnosing journey failures by pinpointing problematic time periods.
-
Graph Components
-
Title: The "Error % Trend for Top 5 Journeys" widget summarizes the error percentage trends for the top five journeys, providing insights into their reliability and highlighting areas requiring attention.
-
Legend: The color scale ranges from light orange (0%) to dark brown (100%), representing error rate intensity and providing an intuitive understanding of error severity over time.
-
Y-Axis (Journeys): The monitored journeys are listed, with each journey displayed on a separate row for easy comparison.
-
X-Axis (Time): Represents the timeline of monitoring, allowing the user to track error occurrences throughout the day.
-
Error Bars: Each vertical bar represents an error occurrence and its severity at a specific point in time, with darker bars indicating a higher error percentage.
SyntheticBrJourney - Journey Level
The SyntheticBrJourney - Journey-Level Dashboard gives a clear, real-time view of how well a workflow is performing. It shows the current status (like Healthy, Stale, or Unhealthy) to flag urgent issues, tracks failure rates to spot recurring problems, and measures how long most runs take to catch slowdowns. You can see total runs, successful runs, and failed runs to gauge reliability, while active alerts highlight critical issues needing immediate action. The dashboard includes detailed test run logs and screenshots to help pinpoint errors, and visual trends show if performance or failures are getting worse over time. Color-coded warnings (red/orange) and real-time updates make it easy to prioritize fixes and keep workflows running smoothly.
SyntheticBrJourney - Journey Level Panels
Journey Name
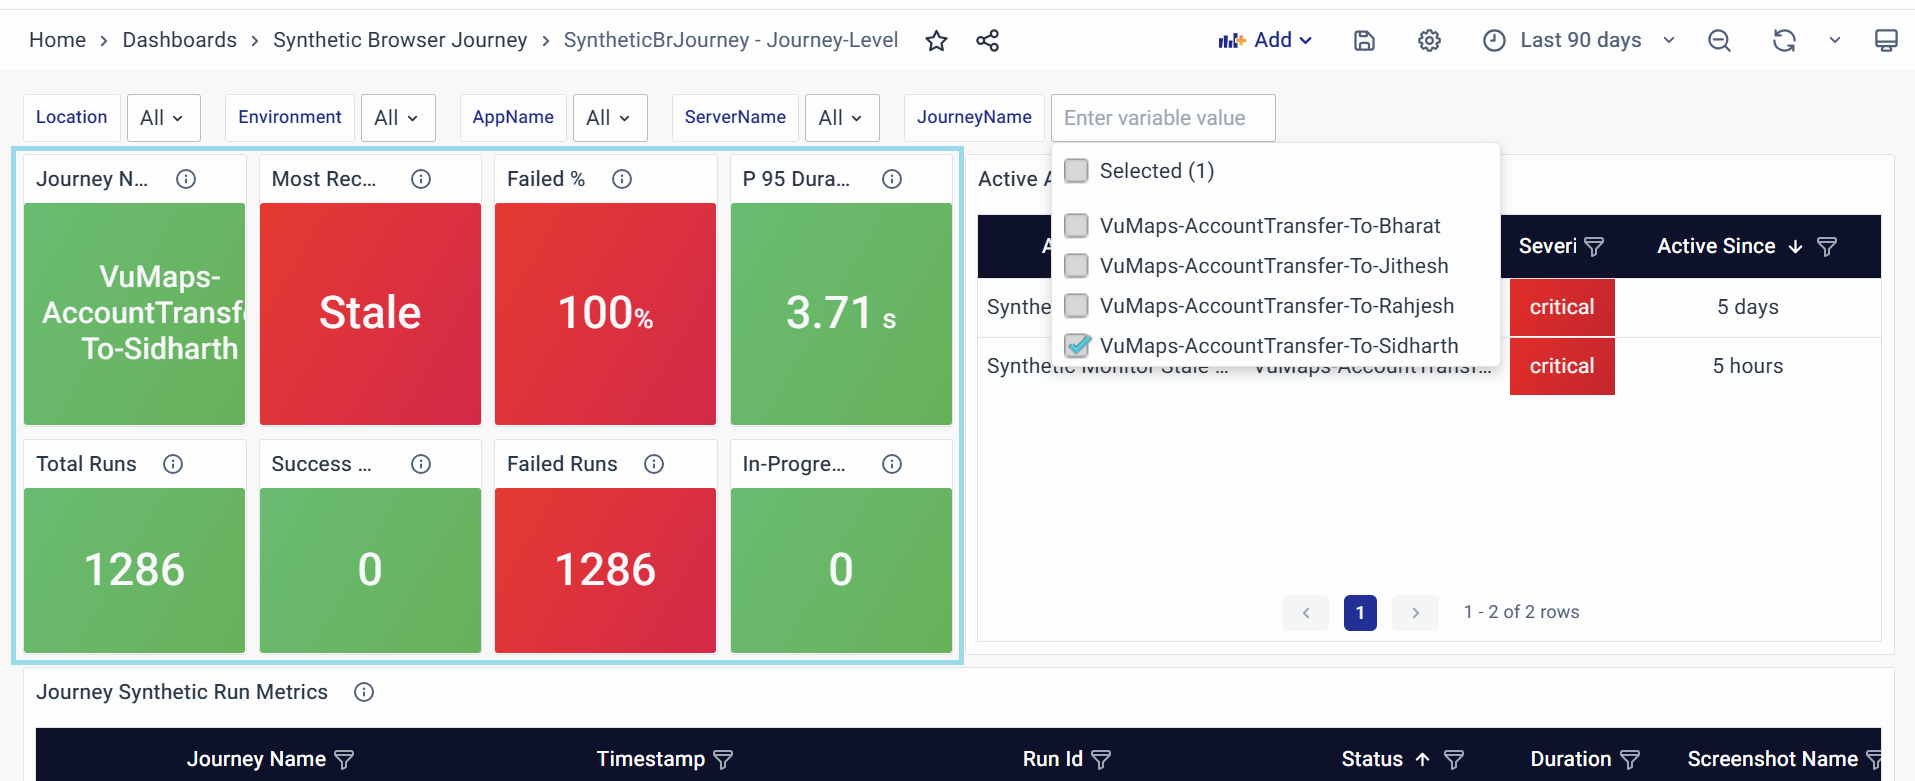
Displays the name of the synthetic journey selected for analysis.
- Purpose: Identifies the specific workflow being monitored.
- Key Attributes: Auto-populated based on user selection from the Journey Metrics table or manual input.
- Usage: Use the dropdown/filter to select a journey for granular analysis.
Most Recent Status
This shows the current health of your journey’s latest run. It helps you quickly spot issues that need attention.
- Purpose: Helps you quickly see if there’s a problem that needs attention right away. For example, if the status is "Stale" (not running on time) or "Unhealthy" (errors or slowdowns), you’ll know to act immediately.
- Thresholds:
- Red:
- Stale: The journey hasn’t run successfully in over 12 hours.
- Unhealthy: Recent runs had errors, delays, or quality issues.
- Green:
- Healthy: The journey is running smoothly with no recent problems.
- Red:
Failed %
Shows how often the journey’s executions are not completed successfully.
- Purpose: Helps measure the reliability of the journey and flags patterns of recurring problems. A high failure rate means there’s likely a consistent issue that needs fixing.
- Thresholds:
- Red: Failure rate is high (more than 5 out of every 100 runs fail).
- Green: Failure rate is low (5 or fewer out of every 100 runs fail).
P 95 Duration
Reflects how long most journey executions take to complete, ignoring extreme outliers. For example, if P95 is 10 seconds, 95% of runs finish in 10 seconds or less.
- Purpose: Helps spot performance slowdowns that might frustrate users or disrupt workflows. A high P95 means a significant portion of runs are slower than expected.
- Thresholds:
- Orange (Warning): Most runs take longer than 15 seconds to complete.
- Red (Critical): Most runs take longer than 105 seconds to complete.
Total Runs
Total executions of the journey in the selected timeframe.
- Purpose: Indicates monitoring frequency and coverage.
- Additional Notes: Low counts may signal missed executions or scheduling misconfigurations.
Success Runs
Number of error-free executions.
- Purpose: Benchmarks journey stability and success rate.
- Analysis Tips: Compare with Failed Runs to identify failure trends.
Failed Runs
The total number of times the journey was not completed successfully due to errors, crashes, or timeouts.
- Purpose: Highlights how often the journey is breaking down or getting stuck, which can disrupt workflows or user experiences.
- Thresholds:
- Red: Even one failed run is flagged, as it indicates an unresolved issue.
In-Progress Runs
Number of currently executing instances.
- Purpose: Monitors real-time test activity and system load.
- Analysis Tips: Prolonged "in-progress" states may indicate resource bottlenecks or slow dependencies.
Active Alerts
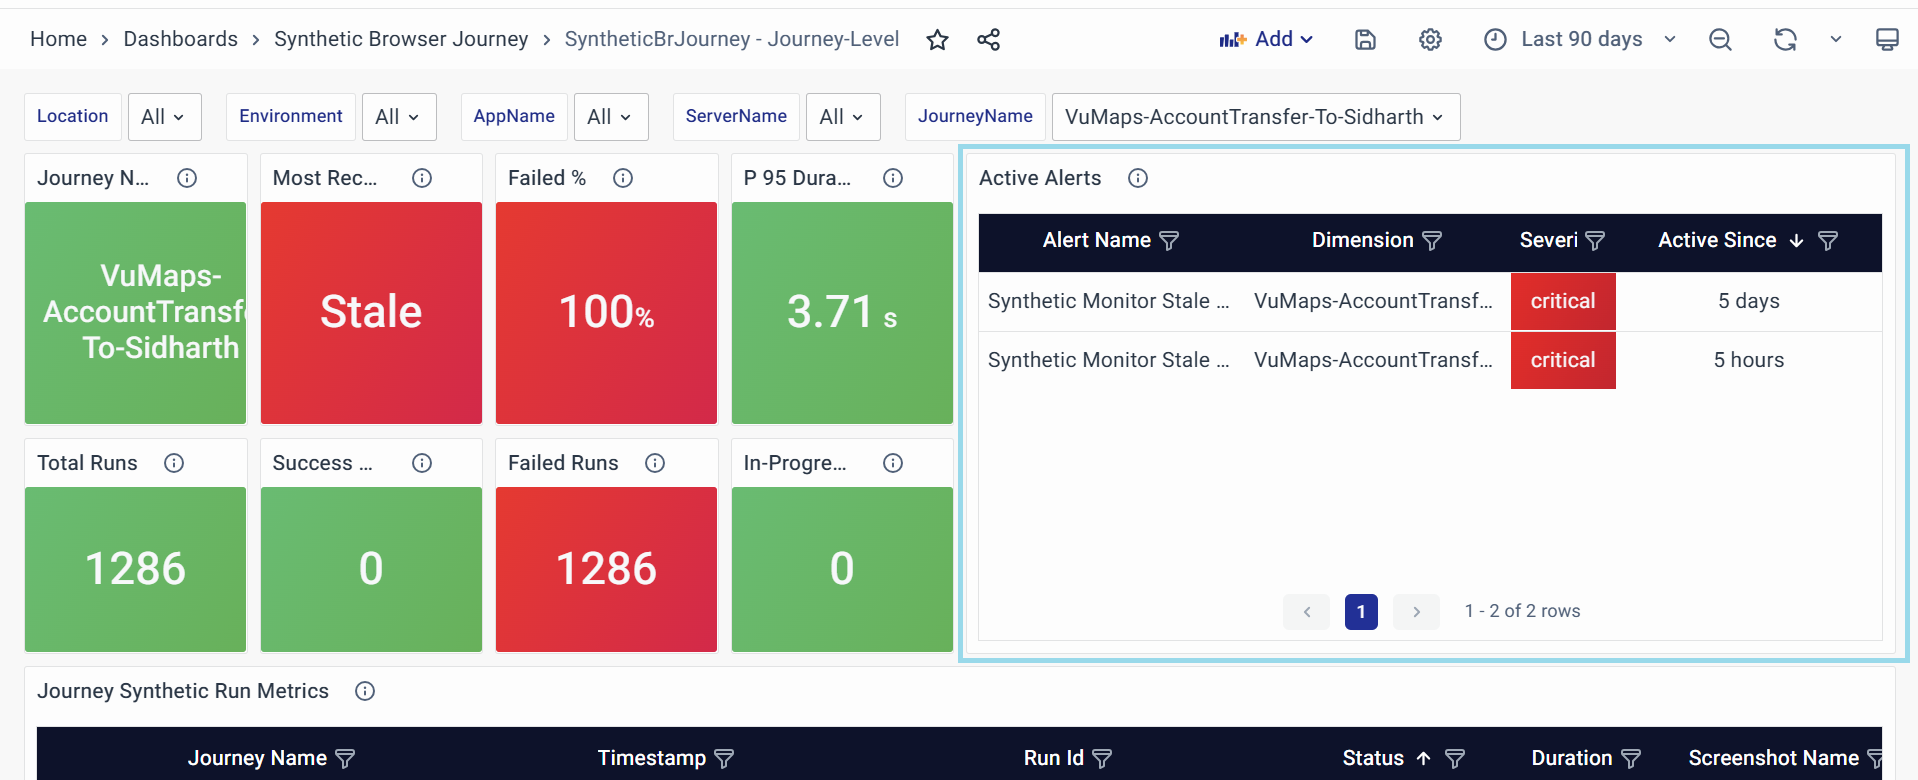
Shows live notifications about issues affecting the journey that haven’t been fixed yet.
- Purpose:
- Helps teams quickly see and prioritize the most serious issues needing attention.
- Sorts alerts by urgency (how severe the problem is) and how long it’s been unresolved.
- Key Attributes:
- Alert Name: Type of problem (e.g., "Journey Not Running on Time" or "Too Many Errors").
- Dimension: Which specific journey or part of it is having trouble (e.g., "Account Transfer Process")?
- Severity: How urgent the problem is (e.g., "Critical" means drop everything and fix this now).
- Active Since: How long the problem has been going on (e.g., "3 days without a fix").
- Visual Indicators:
- Red: Critical problems (e.g., journeys not running for hours, major errors).
This helps teams act fast, focus on what matters most, and keep workflows running smoothly.
Journey Synthetic Run Metrics
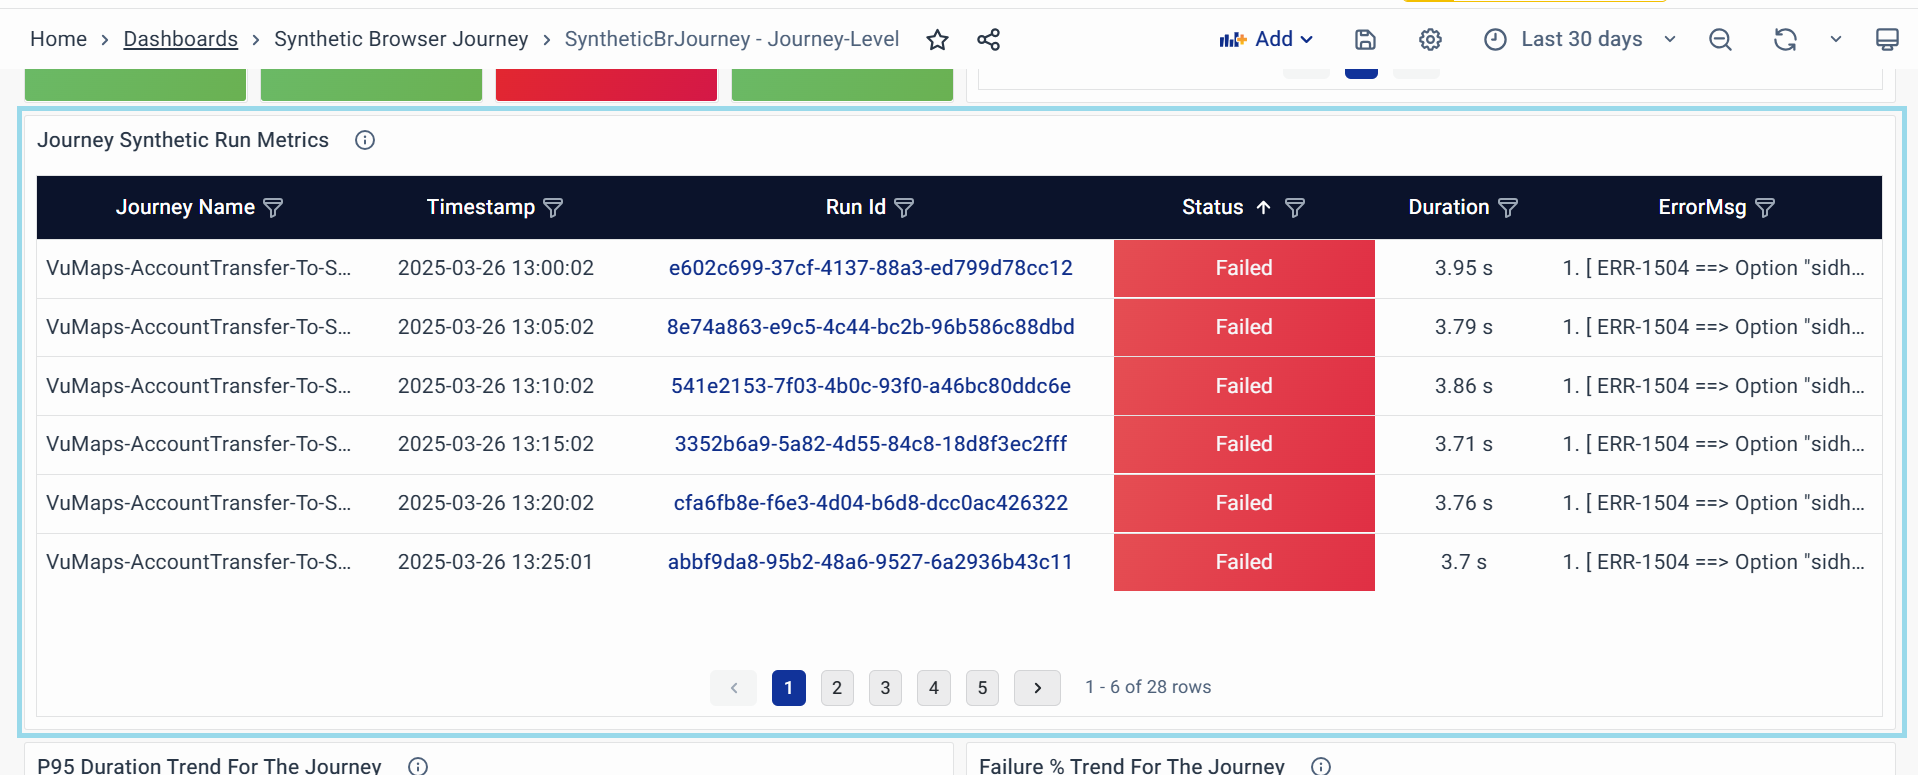
Shows a detailed list of recent test runs for the journey, including whether they succeeded, how long they took, and visual proof of their results (like screenshots).
-
Purpose:
- Lets you dig into individual test runs to spot patterns, delays, or failures.
- Helps pinpoint why a problem happened by showing exactly when it occurred and what it looked like.
-
Key Attributes:
- Journey Name: The specific workflow being tested (e.g., "Account Transfer Process").
- Timestamp: When the test run happened.
- Run ID: A clickable Unique ID that opens the Synthetic Browser Journey - Run Level Page Dashboard for detailed run analysis.
- Status: Whether the run succeeded, failed, or is still in progress.
- Duration: How long the run took to finish.
- ErrorMsg: Displays the error message generated during a failed test run.
-
Visual Indicators:
- Orange (Warning): Runs taking longer than 10 seconds to complete.
- Red (Critical): Runs taking longer than 15 seconds to complete.
-
Usage Tips:
- Click the Run ID to see a breakdown of every step in that test run, including errors.
- Click the Screenshot Name to view images showing exactly where a failure occurred.
- Sort by Duration to quickly find the slowest runs or sort by Status to focus on failed tests first.
P95 Latency Trend For The Journey
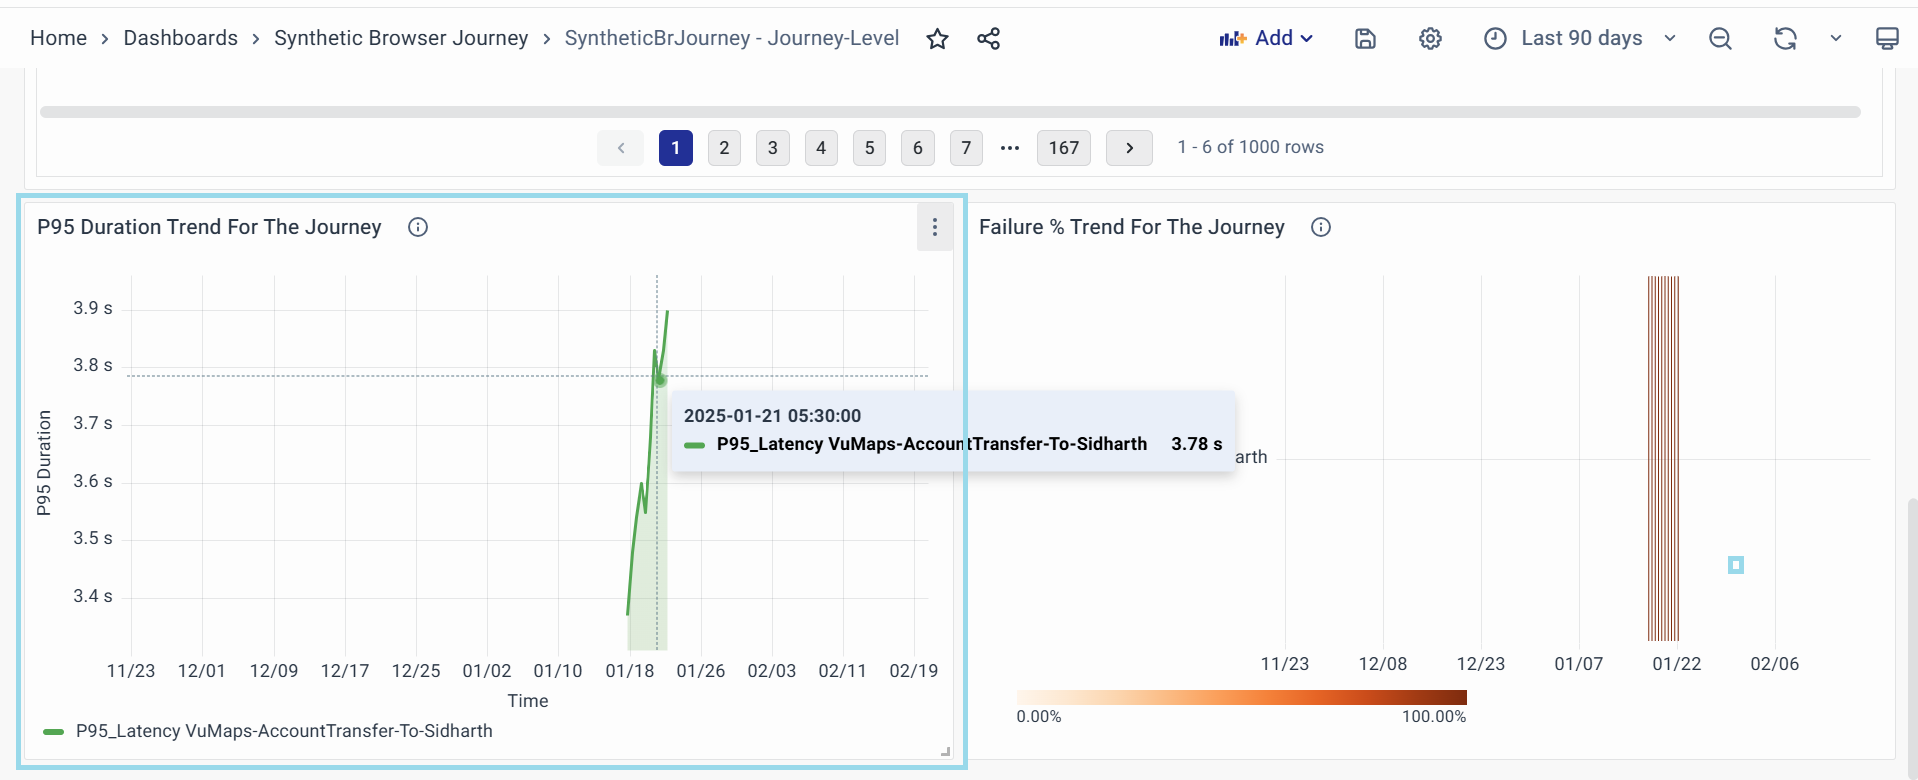
A time-series graph showing the 95th percentile (P95) latency trend for the selected journey over a specified period.
- Purpose:
- Tracks performance consistency and identifies prolonged delays or spikes in execution times.
- Helps correlate latency issues with specific timeframes.
- Key Attributes:
- X-Axis (Time): Timeline of executions (e.g., hours, days).
- Y-Axis (P95 Duration): Latency in seconds, representing the "slowest" 5% of executions.
- Data Points: Each point reflects the P95 latency for a batch of runs.
- Thresholds:
- Orange (Warning): Latency exceeds 10 seconds — investigate potential bottlenecks.
- Red (Critical): Latency exceeds 15 seconds — urgent action required.
- Visual Indicators: Trend lines show gradual increases/decreases in latency.
- Actionable Steps: Click on spikes to Add Annotation.
Failure % Trend For The Journey
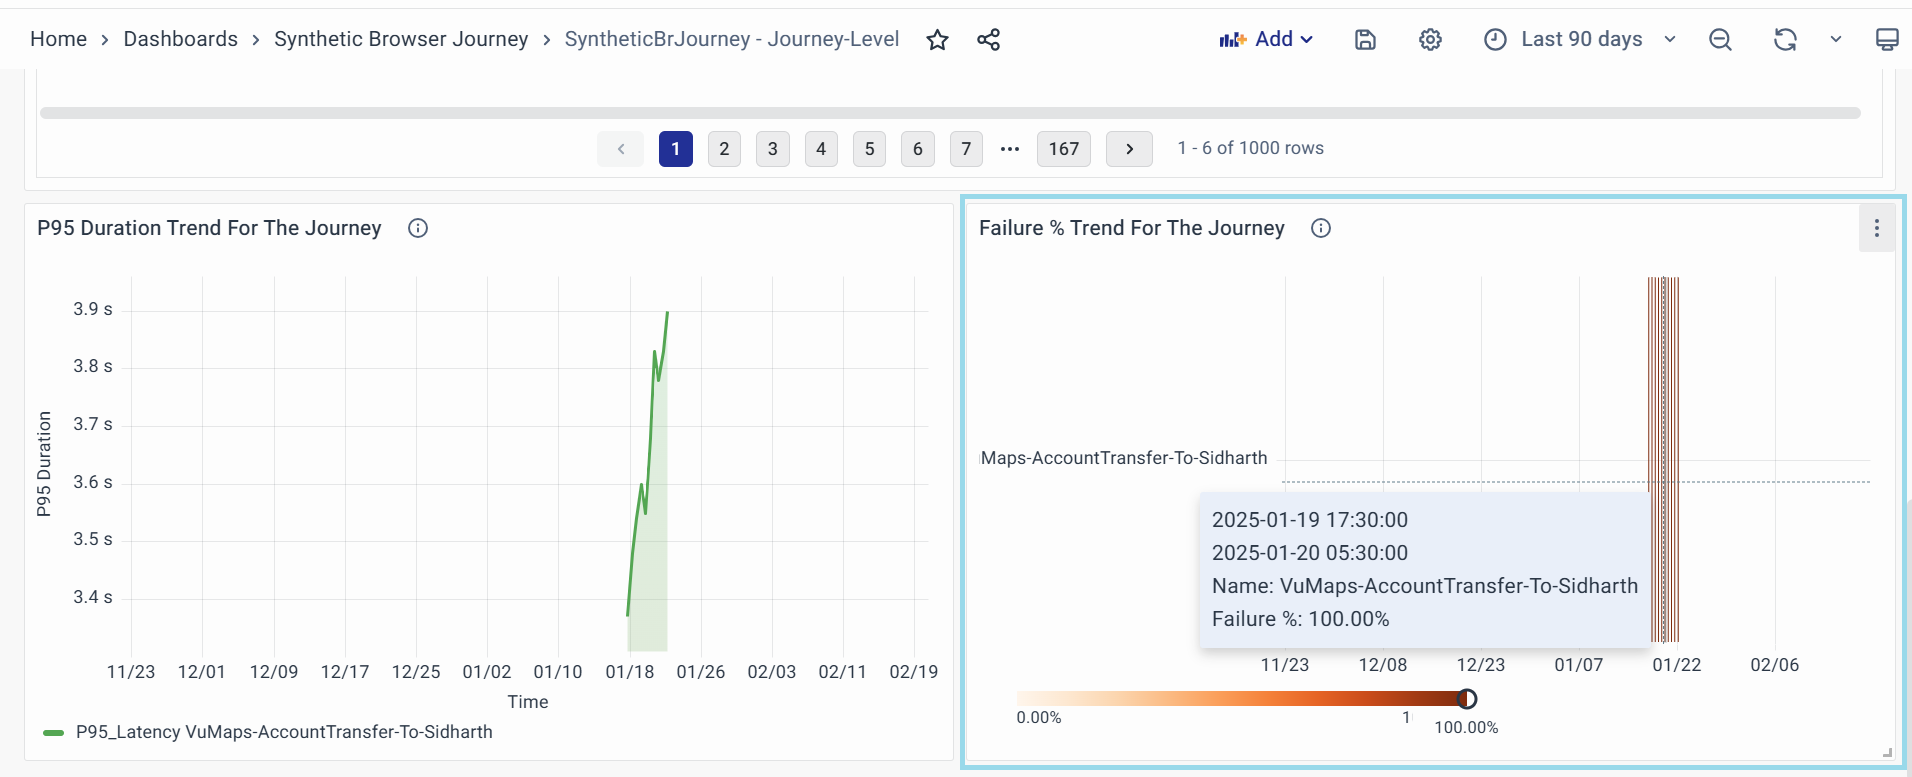
Displays the failure percentage trend for a specific journey over time, helping users identify failure patterns, peaks, and recurring issues.
- Purpose:
- Helps track the reliability of different journeys by visualizing failure trends.
- Identifies spikes or consistent failure occurrences that may require deeper investigation.
- Enables correlation of failures with specific time periods for root cause analysis.
- Key Attributes:
- Journey Name: The specific transaction or workflow being tracked.
- Timestamp Range: The time period during which failures were recorded.
- Failure Percentage: The percentage of failed executions within the selected timeframe.
- Visual Indicators:
- X-Axis (Time): Displays the timeline over which the failures occurred.
- Y-Axis (Journey Name): Lists the journeys being monitored.
- Failure % Color Scale:
- Light Orange: Low failure percentage.
- Dark Orange/Red: High failure percentage (critical issue).
- Usage Tips:
- Hover over bars to see specific timestamps and failure percentages.
- Identify trends where failure rates spike, which may indicate system-wide issues.
SyntheticBrJourney - Run Level Page
The SyntheticBrJourney - Run Level Page dashboard offers a detailed, step-by-step breakdown of individual test runs to troubleshoot specific issues. It shows the run status, execution time, and completed steps versus total steps to spot incomplete runs. The Final Run Description explains why a run failed, while Active Alerts highlight urgent unresolved issues. Users can view screenshots and logs for visual proof of failures, check which step first caused errors, and analyze delays in specific actions. This page helps teams quickly diagnose where and why a workflow broke down, using real-time data and simple visuals to fix problems faster.
SyntheticBrJourney - Run Level Page Panels
Journey Name
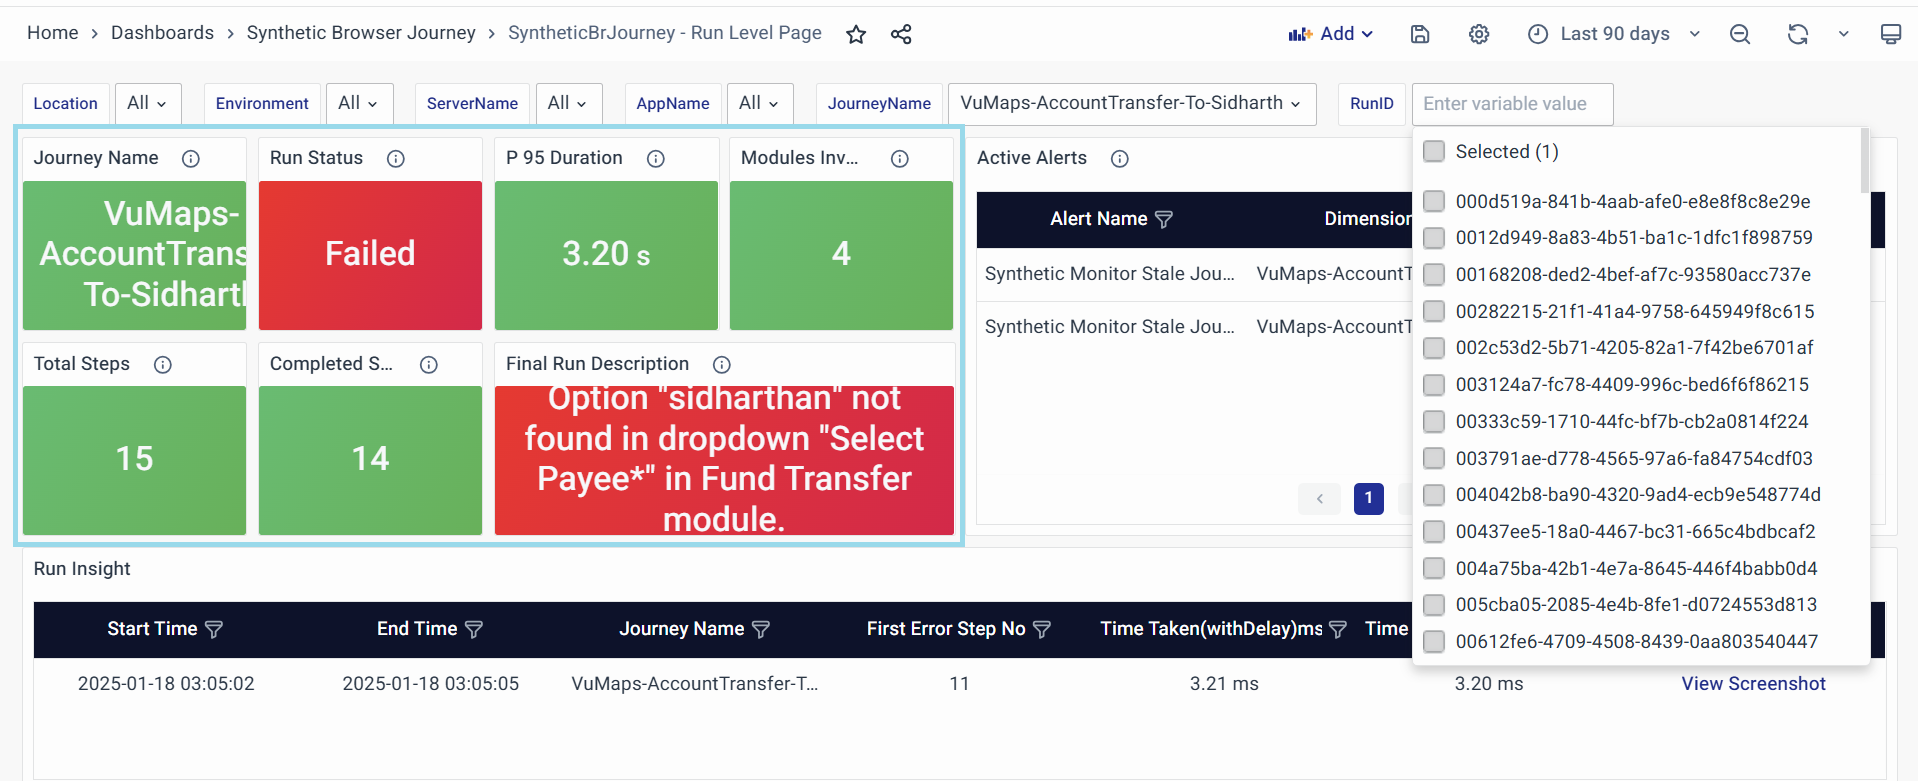
Displays the journey name that was executed.
- Purpose:
- Identifies which synthetic journey is being analyzed.
- Helps users focus on a specific journey for detailed examination.
- Key Attributes:
- Users can manually select a JourneyName and RunID from the dropdown at the top to analyze past runs.
Run Status
Displays the current execution status of the selected journey run.
- Purpose:
- Provides real-time information on whether the run was successful, failed, or still in progress.
- Helps users quickly determine if an issue needs investigation.
- Usage: If the status is "Failed," check the Final Run Description and Active Alerts panels for more details.
P 95 Duration
Displays the 95th percentile duration for the selected run, representing how long most executions took to complete, excluding extreme outliers.
- Purpose:
- Helps monitor the journey's performance and execution time.
- Identifies slow runs that might impact the user experience.
- Thresholds & Indicators:
- Warning (Orange): Duration exceeds 105 seconds.
- Critical (Red): Duration exceeds 15 seconds.
- Usage: Compare this value with past runs to identify performance trends.
Modules involved
Displays the number of modules involved in the execution of the journey.
- Purpose:
- Provides insight into the complexity of the journey.
- Helps users understand which components are part of the execution.
- Usage:
- Use this information to verify if the correct modules were included in the execution.
- If unexpected failures occur, check if any modules are missing or incorrectly configured.
Total Steps
Displays the total number of steps expected in the journey execution.
- Purpose: Defines the complete workflow that the synthetic journey should follow.
- Usage:
- If the Completed Steps count is lower than this value, it indicates that the run was incomplete or terminated early due to an issue.
- Compare this value with historical executions to identify discrepancies.
Completed Steps
Displays the total number of steps that were successfully completed in the journey execution.
- Purpose:
- Confirms whether the journey executed all expected steps.
- Helps diagnose incomplete executions caused by timeouts, errors, or failures.
- Usage: If the Completed Steps value is lower than the Total Steps, check the Final Run Description for failure reasons.
Final Run Description
Provides a detailed summary of the run’s final status, explaining why it failed or stopped.
- Purpose:
- Helps users understand the cause of failures or abnormal behavior.
- Assists in troubleshooting by providing context for errors.
- Example Values:
- Timeout or unexpected banner state
- Insufficient Fund
- Usage:
- If the description highlights an issue, correlate it with Active Alerts for deeper information.
- Use this panel as a reference when debugging synthetic journey failures.
Active Alerts
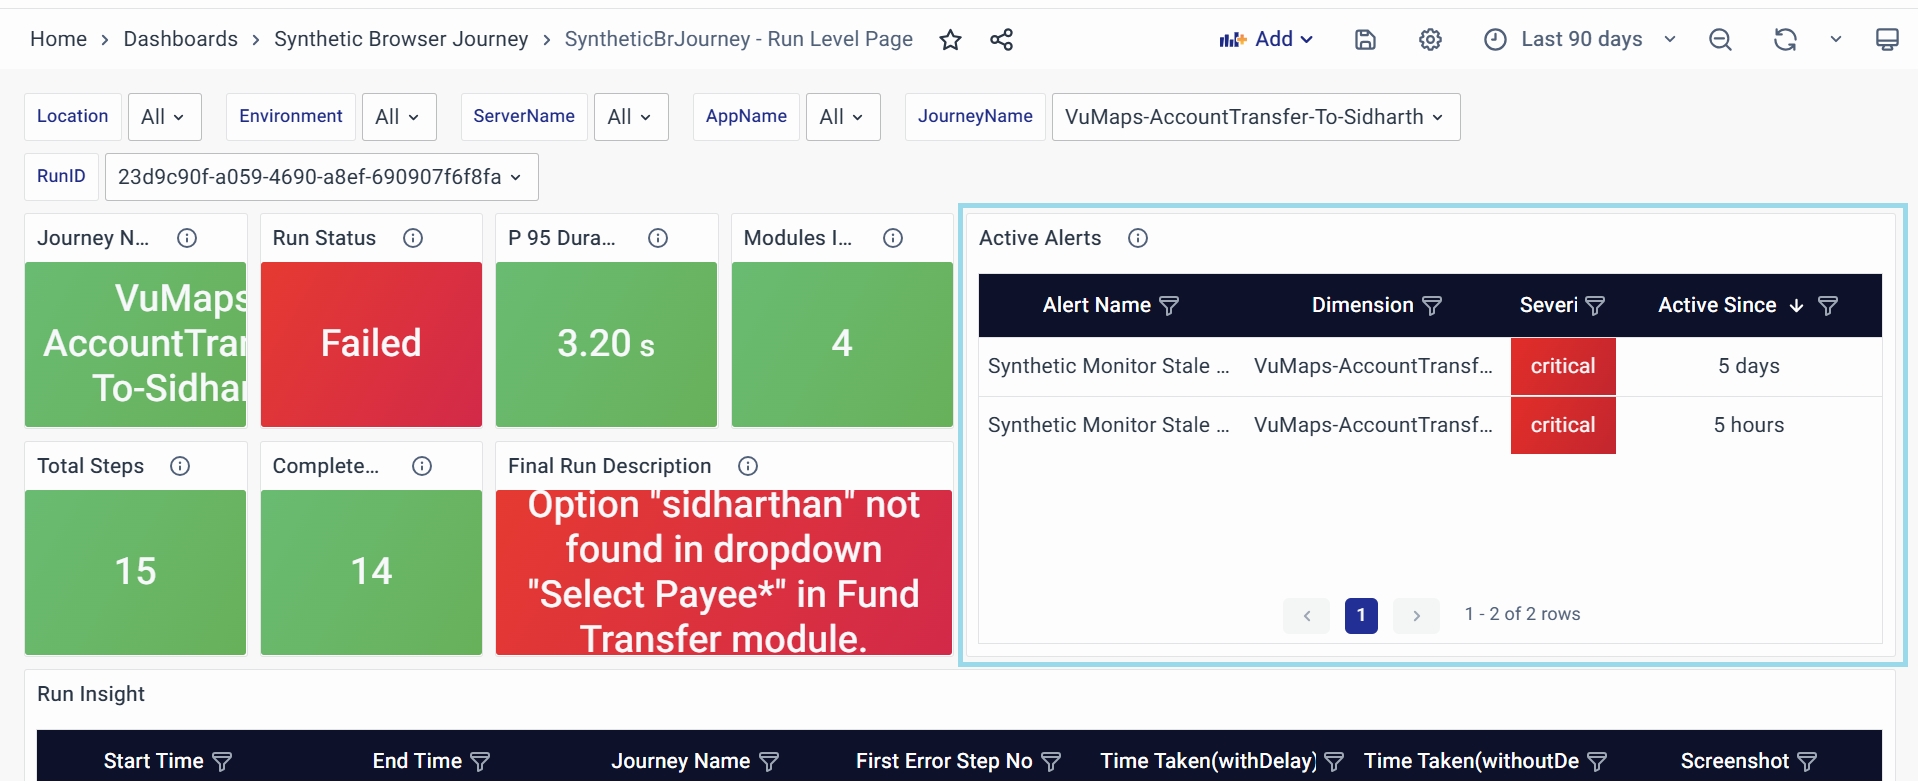
Provides real-time notifications about ongoing issues or failures in the journey execution.
- Purpose:
- Helps teams quickly identify and respond to critical issues affecting the journey.
- Prioritizes troubleshooting based on the severity and duration of alerts.
- Key Attributes:
- Alert Name: Identifies the alert triggered(e.g.,”High Journey Duration”)
- Dimension: Specifies the Impacted components or process
- Severity: Indicates urgency(Critical, Warning, or Info)
- Active Since: Displays how long the alert has been active.
- Usage:
- Critical Alerts require immediate attention, such as high error rates or prolonged execution times.
- Alerts active for a long time may indicate persistent system issues.
- Cross-reference with Final Run Description to understand the cause of the issue.
Run Insight
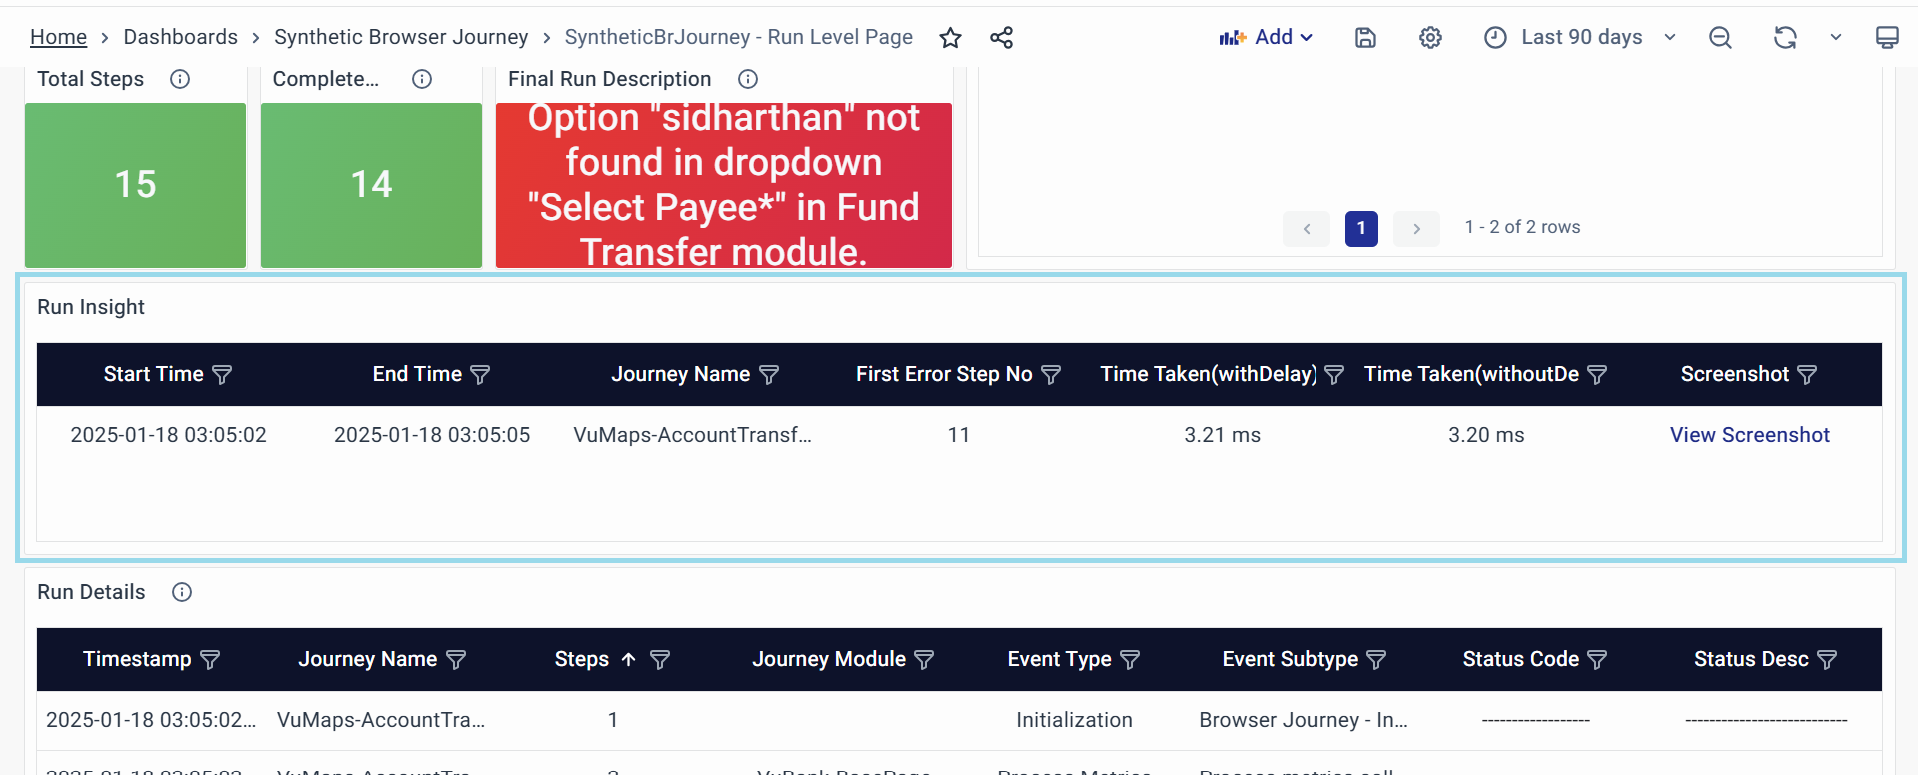
Displays key execution metrics and error-related information for the selected journey run.
- Purpose:
- Helps analyze the run's performance and identify bottlenecks.
- Provides insights into delays and error-prone steps.
- Key Attributes:
- Start Time: The exact timestamp when the run started.
- End Time: The exact timestamp when the run ended.
- Journey Name: The journey name executed.
- First Error Step No: The first step where an error was encountered
- Time Taken (with Delay) ms: Total execution time including delays
- Time Taken (without Delay) ms: Total execution time excluding delays
- Screenshot: Clickable link to view the screenshot in Synthetic Browser Journey - Screenshot Dashboard
- Usage:
- If execution time is significantly different with and without delays, investigate slow-performing steps.
- First Error Step No pinpoints where the journey started failing.
- Click the Screenshot link to see visual evidence of the failure.
Run Details
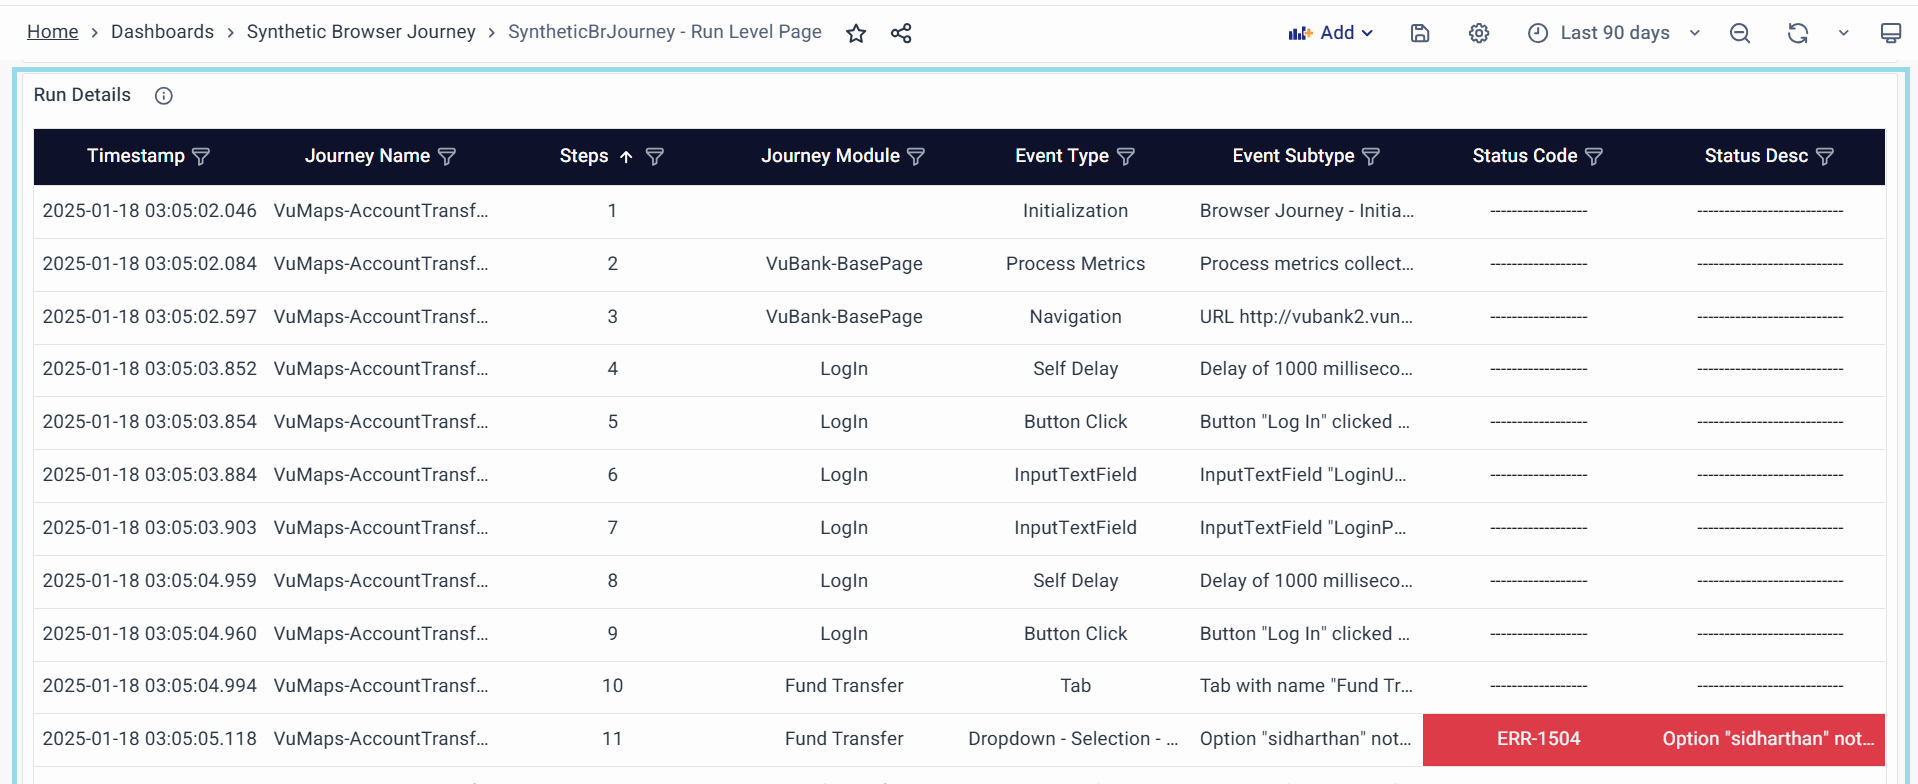
Displays detailed logs and execution data for each step in the journey run.
-
Purpose:
- Provides a granular breakdown of each action taken during the execution.
- Helps diagnose specific failures, delays, and unexpected behavior.
-
Key Attributes:
- Timestamp: Time when the step was executed.
- Journey Name: The name of the journey being executed.
- Steps: The specific step number in the execution.
- Journey Module: The module involved in that step, Some Examples are:
- Fund Transfer
- Login
- Logout
- Event Type: Type of event occurring Some Examples are:
- Initialization
- Button Click
- Dropdown - Selection
- Event Subtype: Additional classification of the event Some Examples are:
- Browser Journey - Initiated
- The button "Log In" clicked successfully
- Option "Username" selected successfully in the dropdown "Select Payee"
- Status Code: HTTP or system response code.
- Status Desc: Description of the event status Some Examples are:
- Timeout or unexpected banner state
- Insufficient Fund
-
Usage:
- If a specific step fails, check the Status Code and Status Desc for more details.
- Look at Event Type & Subtype to determine if the failure was due to UI interaction, navigation, or an API call.
- Use the Journey Module to verify whether the issue is module-specific.
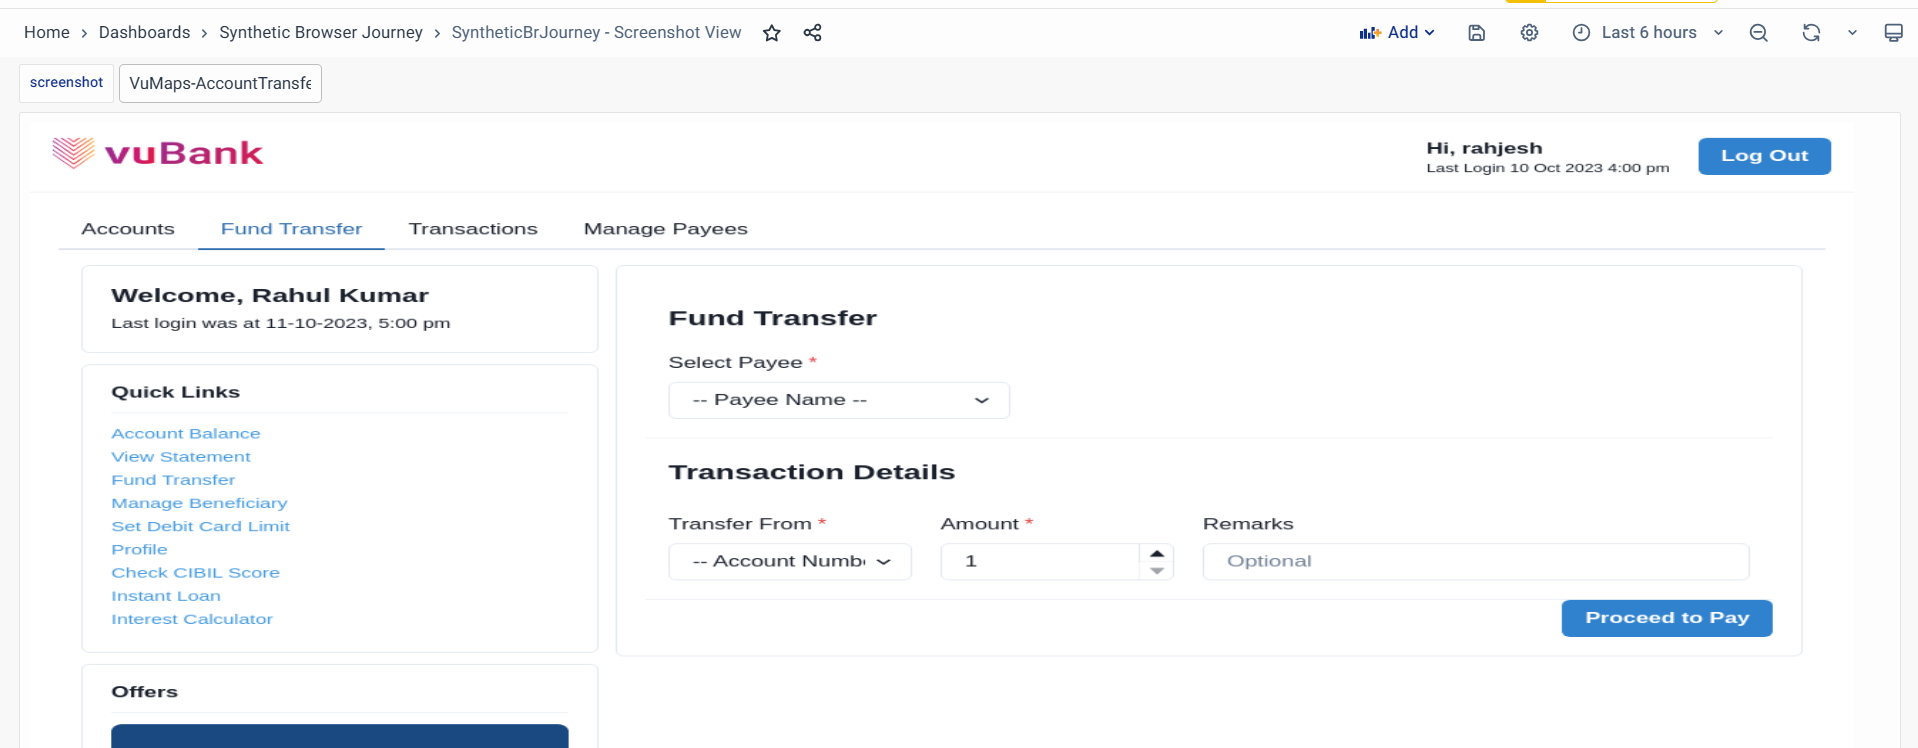
Synthetic Browser Journey - Screenshot view
This Synthetic Browser Journey - Screenshot view Dashboard provides direct access to images captured during synthetic browser journey tests. Each screenshot serves as visual evidence of a test step—helping you identify errors, verify UI behavior, or analyze performance-related slowdowns.
Example: