Operational Metrics Dashboard
The Operational Metrics Dashboard provides observability into system performance and user behavior across vuSmartMaps. It enables monitoring of event processing rates, storage usage, login trends, alert KPIs, and user activity over selectable time ranges. This guide walks you through accessing and understanding the key panels available on this dashboard to help you make informed operational decisions.
Accessing the Operational Metrics Dashboard
To access the Configuration Metrics Dashboard:
- Navigate to the left navigation menu -> Dashboards
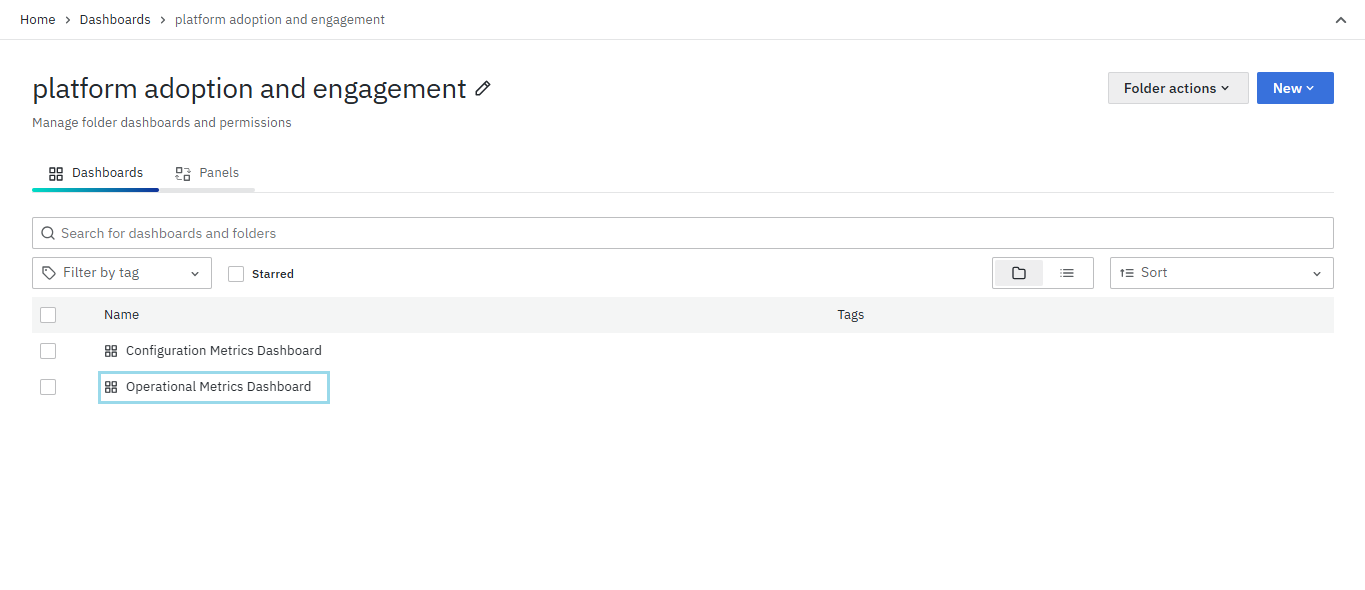
- In the search bar, type Platform adoption and engagement, open the folder, and then click on Operational Metrics Dashboard.
Dashboard Panels
Max EPS (Events Per Second)
This panel shows the peak EPS value recorded within the selected time range, offering a quick understanding of data ingestion load. It presents separate values for each week (W1, W2, W3, and W4), highlighting data ingestion trends over four consecutive weeks.
Average Data Ingested Per Second
This panel shows the average volume of data ingested per second, helping assess consistent ingestion patterns and overall system load. It presents separate values for each week (W1, W2, W3, and W4) to track weekly ingestion trends over time.
Data Storage Size
This panel represents the total storage footprint across all hosts. It presents separate values for each week (W1, W2, W3, and W4), enabling weekly tracking of storage trends.

Alert KPIs Panel
This section includes four panels, each presenting alert metrics for a specific weekly range (W1 to W4), enabling you to monitor alert activity and resolution trends over the past four weeks.

Each panel displays key information such as:
- Total Alerts: Number of alerts generated.
- Critical and Error Alerts: Count of critical and error-level alerts.
- Cleared Alerts: Number of critical and error alerts that were resolved.
- Minimum and Maximum MTTD (Mean Time to Detect): Time taken to detect issues.
- Minimum and Maximum MTTC (Mean Time to Clear): Time taken to resolve issues.
- Alert Volume Dates: The days with the minimum and maximum alerts reported during the week.
These week-wise panels (W1 to W4) help identify trends, compare alert loads across weeks, and evaluate responsiveness in detecting and clearing issues.

User Login Activity Panel
This section contains four panels displaying user login activity for each week (W1 to W4), helping track user engagement and session durations over the past four weeks.

Each weekly panel provides key metrics including:
- User Name: Identifies the user who logged in.
- Total Logins: Number of login sessions initiated by the user.
- Max Time Spent: The longest duration of a single session by the user.
- Total Time Spent: Aggregate login time over the week.
By reviewing login counts and session durations across weeks W1 through W4, you can analyze user access patterns, monitor active usage, and detect unusual login behavior.
Top 5 Most Visited Dashboards By User Panel
This section presents four weekly panels (W1 to W4) displaying the top 5 dashboards most frequently accessed by individual users over each respective week.

Each panel includes:
- Username: The user who accessed the dashboards.
- Dashboard: The name of the dashboard visited.
- Visited: The number of times the dashboard was accessed by the user during that week.
Tracking these metrics week-by-week helps identify key users, their dashboard preferences, and usage trends, providing insights into platform engagement and operational focus areas.
Top 5 Most Visited Dashboards
This section features four weekly panels (W1 to W4) listing the top 5 dashboards with the highest overall visit counts across all users during each respective week.

Each panel shows:
- Dashboard: The title of the dashboard.
- Visit Count: Total number of visits the dashboard received in that week.
Analyzing these trends over consecutive weeks helps identify the most accessed dashboards platform-wide, supporting prioritization for maintenance, optimization, and user support.
Activities Performed by Users Panel
This section includes four weekly panels (W1 to W4) summarizing the actions users performed during each week.

Each panel displays:
- Username: The user performing the activity.
- View/Create/Update/Delete: Counts of each type of action performed by the user.
- Total: (If applicable) Total number of actions during the week.
Tracking these activities helps monitor user engagement, contributions, and potential unauthorized changes over time.
Activities Performed on Objects Panel
This section presents weekly summaries (W1 to W4) of actions performed on system objects.

Each panel lists:
- Object: The type of item affected (e.g., Dashboard, Datasources, Preferences).
- View/Create/Update/Delete: Counts of actions performed on each object type.
- Total: Total number of actions for that object during the week.
This data helps track user interactions with various objects, supporting audits and system usage analysis over time.

Conclusion
The Operational Metrics Dashboard provides a comprehensive overview of system performance, user activity, and alert management within vuSmartMaps. Regularly reviewing these panels enables teams to gain valuable insights that help optimize resource use, increase user engagement, and improve response times to incidents.
