Configurational Metrics Dashboard
This dashboard provides a comprehensive overview of the configuration activities within the platform. It highlights object creation trends, offering insights into dashboards, alerts, reports, data models, and other configuration elements added over time. By analyzing these metrics, administrators can understand platform usage patterns and identify recent configuration activities.
Accessing the Configuration Metrics Dashboard
To access the Configuration Metrics Dashboard:
- Navigate to the left navigation menu -> Dashboards
- In the search bar, type Platform adoption and engagement, open the folder, and then click on Configuration Metrics Dashboard.

Dashboard Panels
The Configuration Metrics Dashboard consists of multiple panels grouped by object type and time range. Each panel displays a count of objects created, helping track adoption and setup activity across different configuration entities with time-based analysis.
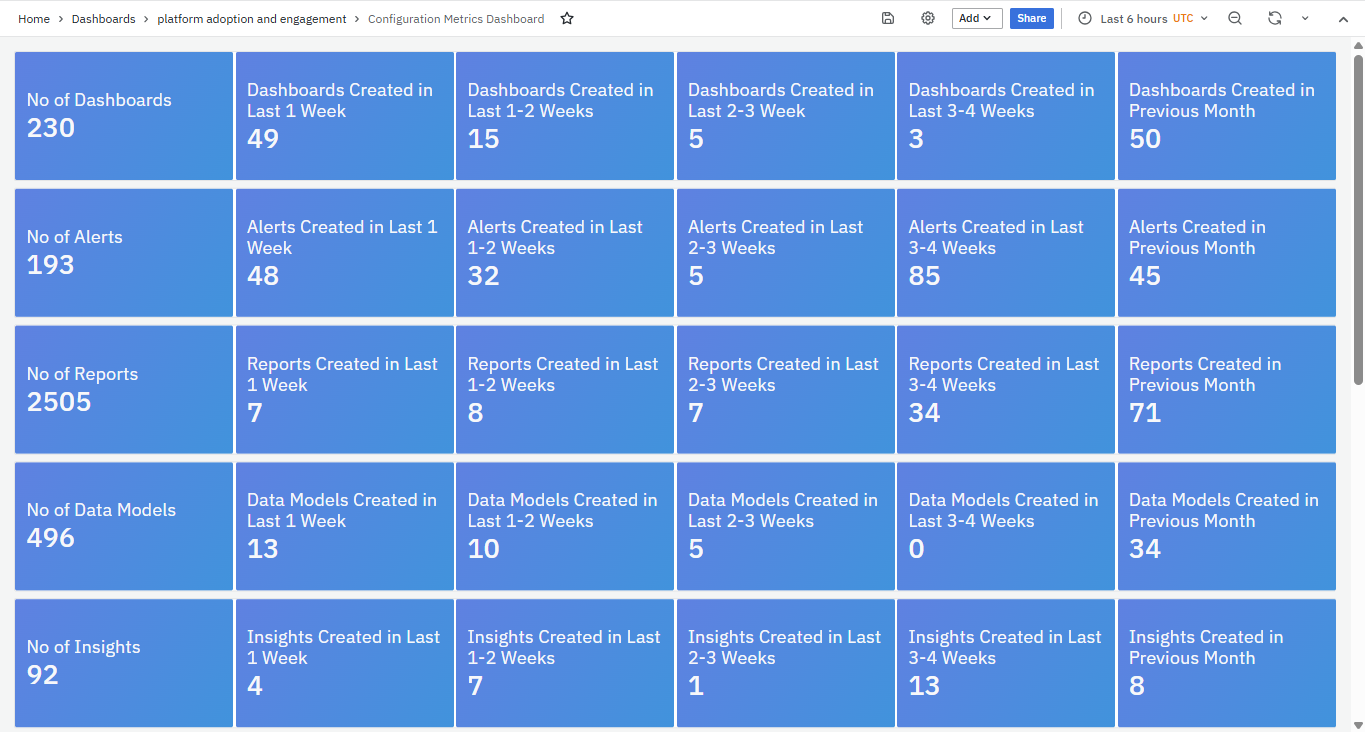
Each column represents a configuration object type, such as:
- Dashboards
- Alerts
- Reports
- Data Models
- Insights
- UTM
- Log Analysis
- Data Enrichments
- Context Streams
- O11ySource Instances
Each row represents a specific time range, showing how many objects were created in that period. The time range rows are organized as:
- Total count (e.g., Total Dashboards)
- Last 1 week
- Last 1–2 weeks
- Last 2–3 weeks
- Last 3–4 weeks
- Previous month
Dashboards Metrics Panels
- No. of Dashboards: Total dashboards created till date.
- Dashboards Created in Last X Weeks: Tracks dashboards created in weekly intervals.
- Dashboards Created in Previous Month: Shows the dashboards configured in the previous calendar month.
Alerts Metrics
- No. of Alerts: Total alert rules configured on the platform.
- Alerts Created in Last X Weeks: Weekly creation trend of alerts.
- Alerts Created in Previous Month: Total number of alerts configured last month.
Reports Metrics
- No. of Reports: Total number of reports created.
- Reports Created in Last X Weeks: Tracks report generation trends over recent weeks.
- Reports Created in Previous Month: Shows the report creation activity in the last month.
Data Models Metrics
- No. of Data Models: Total data models configured.
- Data Models Created in Last X Weeks: Weekly data model creation count.
- Data Models Created in Previous Month: Data models created during the last month.
Insights Metrics
- No. of Insights: Total insights generated using configuration data.
- Insights Created in Last X Weeks: Weekly breakdown of new insights.
- Insights Created in Previous Month: Previous month’s insight generation statistics.
UTMs Metrics
- No. of UTMs: Total UTM configurations added.
- UTMs Created in Last X Weeks: Trends of UTMs created each week.
- UTMs Created in Previous Month: Total UTMs created in the last month.
Log Analysis Metrics
- No. of Log Analysis: Total configured log analysis.
- Log Analysis Created in Last X Weeks: Weekly trend of log analysis configuration.
- Log Analysis Created in Previous Month: Number of log analyses created last month.
Data Enrichment Metrics
- No. of Data Enrichments: Total enrichment configured.
- Data Enrichments Created in Last X Weeks: Weekly breakdown of enrichment creation.
- Data Enrichments Created in Previous Month: Enrichment activities from the previous month.
Context Streams Metrics
- No. of Context Streams: Total number of context streams configured.
- Context Streams Created in Last X Weeks: Weekly stats of context stream configuration.
- Context Streams Created in Previous Month: Total context streams configured in the last month.
O11ySource Instances Metrics
- No. of O11ySource Instances: Count of O11ySource integrations created.
- O11ySource Instances Created in Last X Weeks: Weekly tracking of new O11ySource instances.
- O11ySource Instances Created in Previous Month: Count of O11ySource instances created last month.

Conclusion
The Configuration Metrics Dashboard provides administrators with a bird’s-eye view of how different platform configuration elements are being created and adopted. By tracking trends across dashboards, alerts, reports, data models, and more, stakeholders can evaluate platform adoption, monitor setup activity, and identify periods of peak or declining configuration activity.
Use this dashboard regularly to stay informed and proactively manage platform configuration health and adoption trends.
