Browser RUM Dashboards
Application Overview
The Application Overview Dashboard includes the BRUM App Catalog page, which provides a high-level view of all monitored applications along with key performance metrics. The App Listing panel on this page shows total user sessions, sessions with page and API errors, helping identify areas for improvement. Each application name links to the Browser RUM Overview Dashboard for more detailed insights. The Geo Map feature offers a geographical view of user activity and performance trends, enabling further analysis by region. This dashboard serves as a centralized hub for monitoring and analyzing application performance.
BRUM App Catalog
The BRUM App Catalog offers a bird's-eye view of all the applications in the environment, along with essential performance metrics and status information. It helps users monitor application performance, detect issues, and navigate to detailed dashboards for further analysis.
App Listing
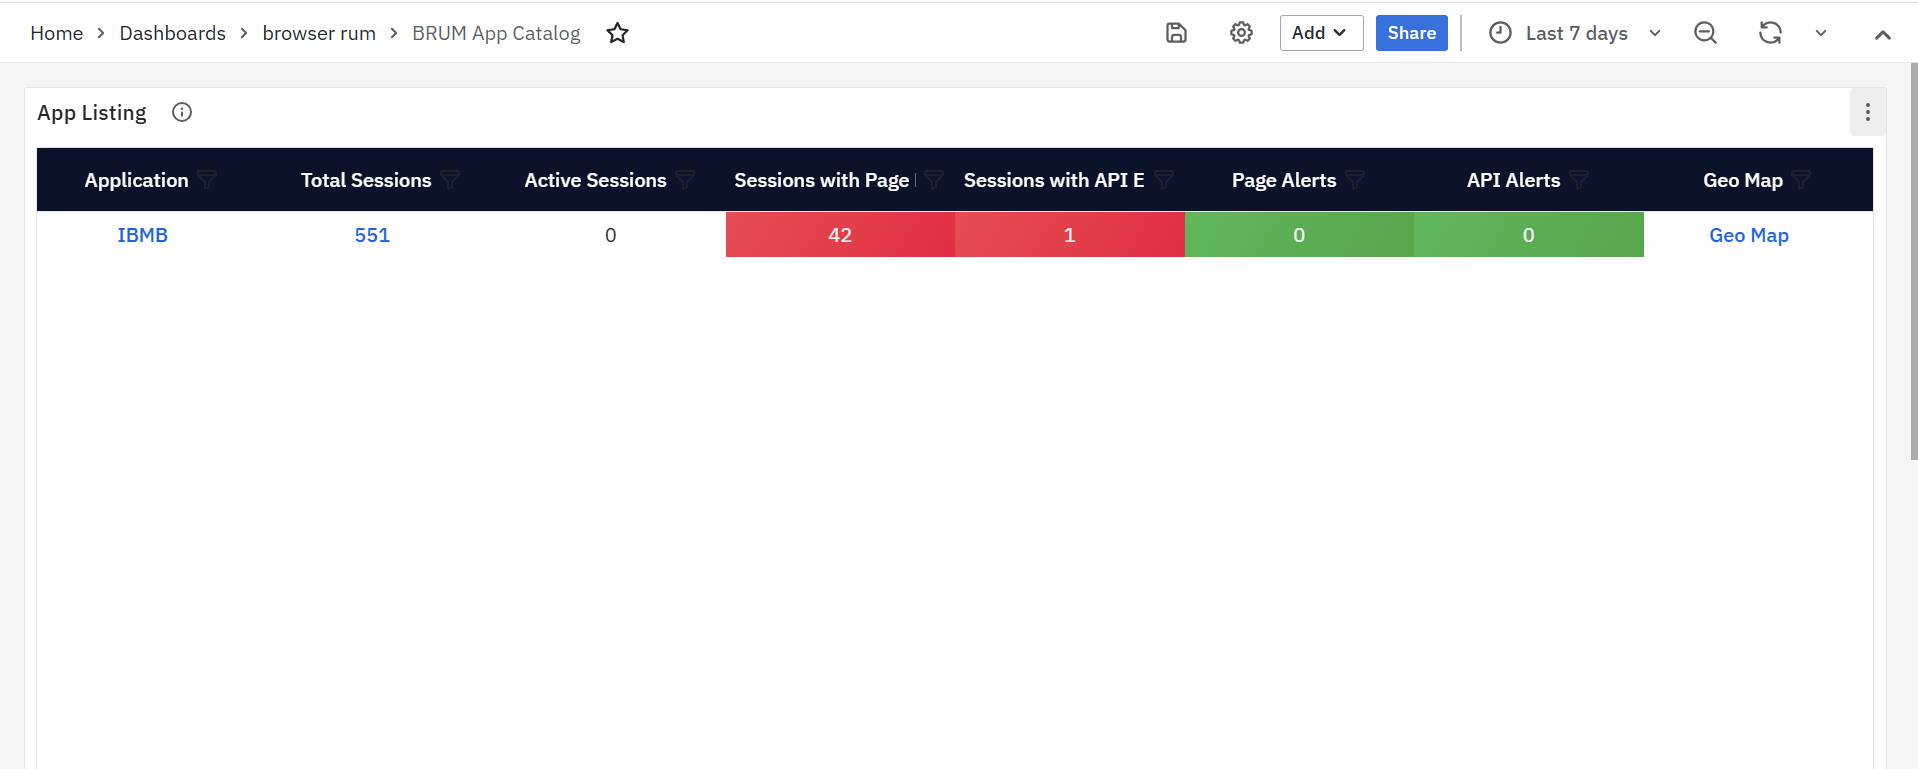
The App Listing panel is the only panel available on the BRUM App Catalog page. It provides a centralized view of key application performance metrics, enabling users to monitor, analyze, and navigate to detailed dashboards for deeper insights. Below are the columns available in this panel, each offering critical information about application performance:
- Application: Displays a list of all monitored applications, Each application name is a clickable link that redirects to the Browser RUM Overview, where detailed performance metrics and trends for the selected application can be explored.
- Sessions: Shows the total number of user sessions for each application during the selected time range, This is a clickable link that redirects to the Browser RUM User Sessions dashboard. A session includes all user interactions, such as page views, clicks, and API requests, within a single visit.
-
- Active Session: Number of currently active (ongoing) user sessions at the time of viewing the dashboard.
- Sessions with Page Errors: Highlights the number of sessions where users encountered page-related errors, such as broken links, slow-loading pages. This Helps identify areas requiring attention to enhance user experience.
- Sessions with API Errors: Indicates the number of sessions affected by API-related issues, such as failed requests, high latency, or timeouts. Useful for tracking backend service performance and ensuring optimal functionality.
- Page Alerts: Displays the number of active alerts related to page performance issues, such as slow load times, layout shifts, or high error rates.
- API Alerts: Shows the number of alerts triggered for API failures, timeouts, or performance degradation. Helps in identifying API endpoints that require immediate attention.
- Geo Map: Includes a clickable link that navigates to the Geo Map, offering detailed metrics such as performance trends by region. Provides a geographical representation of user activity across different locations, helping teams understand performance variations based on user geography.
Detailed Application Metrics Dashboards
The Detailed Application Metrics Dashboards provide a comprehensive view of key performance indicators across various application components, including page load times, API performance, session engagement, long task analysis, and user interactions. By tracking critical metrics such as LCP, FID, CLS, API latency, and error rates, the dashboards enable teams to identify and resolve performance issues. Users can refine the data through customizable filters for Application, Page, API, Browser, and OS, allowing for in-depth analysis and efficient troubleshooting. This holistic approach ensures optimal application performance and a seamless user experience.
BRUM Overview
The Browser RUM (Real User Monitoring) Overview provides a centralized view of application performance, tracking key metrics related to pages, APIs, sessions, long tasks, and user interactions. It helps teams identify performance gaps, monitor real-time user activity, and optimize application responsiveness. The dashboard includes detailed insights into page load times, API response rates, error occurrences, and session trends, ensuring a seamless user experience.
To refine the displayed data, users can apply filters to focus on specific parameters. The available filters include Application, Page, API, Browser & OS. Each filter has a dropdown menu, allowing users to select specific values for more granular analysis. This flexibility ensures that teams can quickly investigate and resolve performance issues affecting different aspects of the application.
BRUM Overview Panels
Pages

The Pages panel provides insights into web page performance, highlighting trends in user interactions, errors, and latency. It helps in identifying slow-loading pages, frequent errors, and performance bottlenecks.
- Page Requests Trends: The Page Requests Trends displays the total number of page requests over the selected time range, making it easier to identify peak traffic periods and usage patterns. This helps teams understand how often users access different parts of the application.
- Page Errors Trends: The Page Errors Trends highlights the number of errors encountered across different pages. These errors may include JavaScript failures, broken links, or missing resources. Identifying error-prone pages ensures a smoother experience for users.
- Page Latency Trends: The Page Latency Trends measures the time taken for pages to load, considering network and rendering delays, making it easier to spot slow-loading pages. Monitoring this trend helps teams optimize page performance and reduce delays.
APIs

The APIs panel provides an overview of how API interactions are performing within the application. It helps in tracking the number of requests, errors, and response times, ensuring that backend services function smoothly.
- APIs Requests Trends: The API Requests Trends presents the total number of API requests made by the application within the selected time range, helping teams understand usage patterns and detect any unexpected spikes or drops in API traffic.
- APIs Errors Trends: The API Errors Trends focuses on API failures, timeouts, and incorrect responses. It provides an overview of how frequently errors occur. Identifying recurring API failures allows teams to diagnose backend issues and improve system stability.
- APIs Latency Trends: The API Latency Trends measures the average response time of API calls, indicating how efficiently the backend processes requests. By analyzing these trends, developers can optimize API performance to ensure fast and seamless interactions.
Web Vitals

The Web Vitals panel focuses on key performance metrics that measure the quality of the user experience. These metrics help teams understand how quickly a page loads, how responsive it is to interactions, and whether unexpected shifts in layout occur during loading.
- FID: FID (First Input Delay) measures how long it takes for a page to respond to the first user interaction, such as clicking a button or entering text into a form. A low FID time means that the page responds quickly, ensuring a smooth experience. On the other hand, a high FID time indicates slow responsiveness, which can make interactions feel sluggish and unresponsive.
- CLS: CLS (Cumulative Layout Shift) tracks unexpected movements of elements on a page during loading. When text, buttons, or images shift unexpectedly, users may find it difficult to interact with the page. A low CLS score means the page remains visually stable, while a high CLS score indicates disruptive shifts that may confuse or frustrate users.
- LCP: LCP (Largest Contentful Paint) measures how long it takes for the largest visible element on a page to load. This could be an image, a video, or a block of text. A lower LCP time indicates that users can see and interact with content more quickly, leading to a better experience. However, a higher LCP time suggests that pages are loading too slowly, which may lead to user frustration.
Sessions
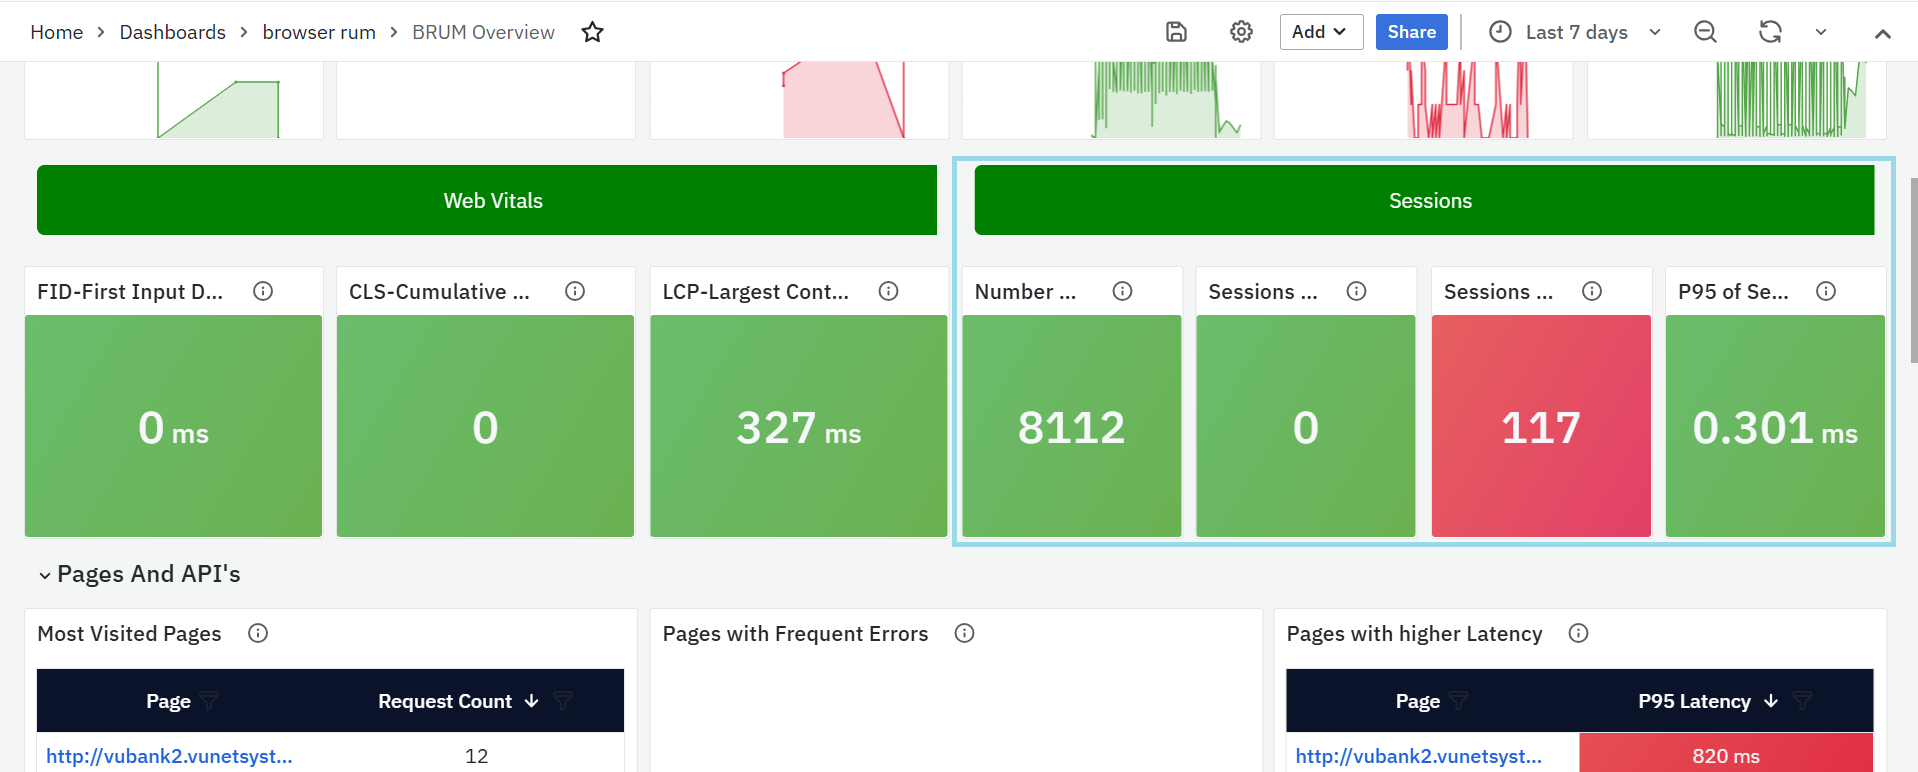
The Sessions panel provides insights into user sessions, helping teams track session counts, errors, and engagement duration. By monitoring this panel, teams can better understand user behavior and detect issues that impact session quality.
- Number of Sessions: The Number of Sessions is the total count of user sessions within the selected time range. A session consists of all interactions a user performs during a visit, including page views, clicks, and API requests. Tracking session counts helps measure user engagement and application usage trends.
- Sessions with Page Errors: The Sessions with Page Errors highlights the number of sessions in which users encountered issues such as JavaScript errors, broken links, or slow-loading pages. By analyzing this data, teams can identify problematic sessions and take steps to resolve issues that negatively impact user experience.
- Sessions with API Errors: The Sessions with API Errors tracks the number of sessions affected by API failures, including timeouts and failed requests. Monitoring this trend helps teams assess API stability from a user perspective and address performance concerns that may disrupt the application’s functionality.
- P95 of Session Duration: The P95 of Session Duration measures the 95th percentile of session durations, providing an estimate of how long most sessions last. This helps in identifying patterns in user engagement and detecting unusual session drop-offs. If session duration trends show a sudden decrease, it could indicate that users are leaving due to performance issues or usability challenges.
Pages and APIs
The Pages and APIs panel provides a comprehensive overview of the most accessed pages and APIs, highlighting their request counts, error occurrences, and latency trends. This panel helps users track frequently visited pages, detect performance bottlenecks, and identify API endpoints that may require optimization, Customizing Panel Settings:
When you click the settings icon next to the panel name, a pop-up appears with Row Options, allowing users to customize the panel settings. This pop-up includes a Title field and a Repeat for dropdown. The Repeat for option lets users select parameters to dynamically replicate the panel based on specific values, making it easier to compare multiple data sets. After selecting the desired settings, clicking Update applies the changes.
Additionally, there is a Delete button next to the panel name, which allows users to remove the panel if it is no longer needed. This functionality helps users tailor the dashboard to their needs, keeping it clean and focused on relevant metrics.
-
Most Visited Pages

- Lists the most frequently accessed pages based on user traffic.
- The Page column displays URLs as clickable links that lead to the Browser RUM Pages Dashboard for detailed analysis.
- The Request Count column shows how many times each page was accessed within the selected time range.
- Helps teams understand which pages are most popular among users.
-
Pages with Frequent Errors
- Identifies pages with the highest number of errors, such as JavaScript failures, missing resources, or broken links.
- The Page column contains clickable links that direct users to the Browser RUM Pages Dashboard for further investigation.
- The Error Count column shows the total number of errors recorded for each page.
- Helps teams prioritize and resolve issues affecting the user experience.
-
Pages with Higher Latency
- Highlights pages with slow loading times, helping teams improve performance.
- The Page column includes clickable links leading to the Browser RUM Pages Dashboard for in-depth load time analysis.
- The P95 Latency column displays the 95th percentile latency, representing the slowest loading times experienced by users.
- Helps teams identify and optimize slow-performing pages to enhance responsiveness
-
Most Invoked APIs

- Displays API endpoints that receive the most requests within the selected time range.
- The API column lists URLs as clickable links leading to the Browser RUM APIs Dashboard for performance monitoring.
- The Request Count column shows the total number of calls made to each API.
- Helps developers track API usage and identify high-demand endpoints.
-
APIs with Frequent Errors
- Lists API endpoints that have encountered the most errors, such as failed requests, timeouts, or incorrect responses.
- The API column contains clickable links directing users to the Browser RUM APIs Dashboard for troubleshooting.
- The Error Count column indicates how often errors occurred for each API.
- Helps teams quickly identify backend issues and improve API reliability.
-
APIs with Higher Latency
- Highlights API endpoints with high response times, which may impact application performance.
- The API column includes clickable links leading to the Browser RUM APIs Dashboard for analyzing response time trends.
- The P95 Latency column shows the 95th percentile response time, representing the slowest API requests.
- Helps developers optimize backend services to reduce delays and improve efficiency.
Long Tasks
The Long Tasks panel provides insights into browser tasks that take longer than expected to complete, potentially impacting the overall user experience. These long-running tasks can cause sluggish page interactions, slow response times, and delays in rendering, affecting user engagement, Customizing Panel Settings:
- When you click the settings icon next to the panel name, a pop-up appears with Row Options, allowing users to configure the panel’s settings. This pop-up contains a Title field and a Repeat for dropdown, which enables users to repeat the panel for specific parameters dynamically. After making the necessary selections, clicking Update applies the changes.
- Additionally, a Delete button next to the panel name allows users to remove the panel if it is no longer needed, helping to keep the dashboard organized and relevant.

Pages with Frequent Long Tasks
Identifies web pages that frequently experience long-running tasks, which may slow down interactions.
- The Page column contains clickable links leading to the Browser RUM Long Tasks Dashboard for in-depth analysis.
- The Long Tasks Count column displays the total number of long tasks recorded for each page during the selected time period.
Helps teams pinpoint performance issues and optimize slow-loading pages for better responsiveness.
Long Tasks Trend: The Number of Long Tasks section tracks how many tasks exceeded the expected execution time during the selected period. A higher count of long tasks suggests potential performance issues, helping teams identify and optimize resource-heavy operations to improve browser responsiveness.
BRUM Pages
The BRUM Pages offers a centralized view of web page performance, tracking key metrics such as errors, slow-loading pages, and user experience indicators like LCP, FID, and CLS. It helps teams detect performance issues, analyze trends, and optimize page responsiveness. Users can refine the displayed data using filters for Application, Page, Browser, and OS, each available as a dropdown for targeted analysis.
BRUM Pages Panels
Top Error Types

This panel provides an overview of the most common error types encountered across web pages.
- The Error Type column categorizes different errors, such as JavaScript failures, network timeouts, and missing resources.
- The Error Count column displays the total number of times each error occurred within the selected time range.
Understanding the most frequent errors helps teams prioritize fixes and enhance application stability.
Slow Pages Listing
This panel highlights pages that load slowly or experience high latency, helping teams identify areas needing optimization.
- The Resource column lists the affected page URLs, each being a clickable link leading to the BRUM Tracelisting (Pages) Dashboard, where detailed traces can be analyzed.
- The Resource Count column shows how many times the resource was accessed.
- The Error Count column displays the total number of errors encountered on the page.
- The P95 Latency column shows the 95th percentile latency, indicating how long the slowest requests took to load.
- The LCP (Largest Contentful Paint) metric tracks how quickly the largest visual element appears.
- The CLS (Cumulative Layout Shift) metric measures unexpected shifts in page layout during loading.
- The FID (First Input Delay) metric captures how long it takes for the page to respond to user interactions.
Monitoring these values helps teams pinpoint slow-loading pages and make improvements to enhance performance.
Error Pages Listing

This panel provides a list of pages where errors frequently occur.
- The Page column displays URLs of pages experiencing issues.
- The Request Count column shows how many times the page was requested.
- The Error Count column tracks the number of errors encountered on the page.
- The P95 Latency column reflects the 95th percentile of load time, helping to detect slow-performing pages.
- The LCP, CLS, and FID metrics provide deeper insights into page load speed, layout stability, and responsiveness, helping teams identify pages needing optimization.
Top Slowest Resources Listing
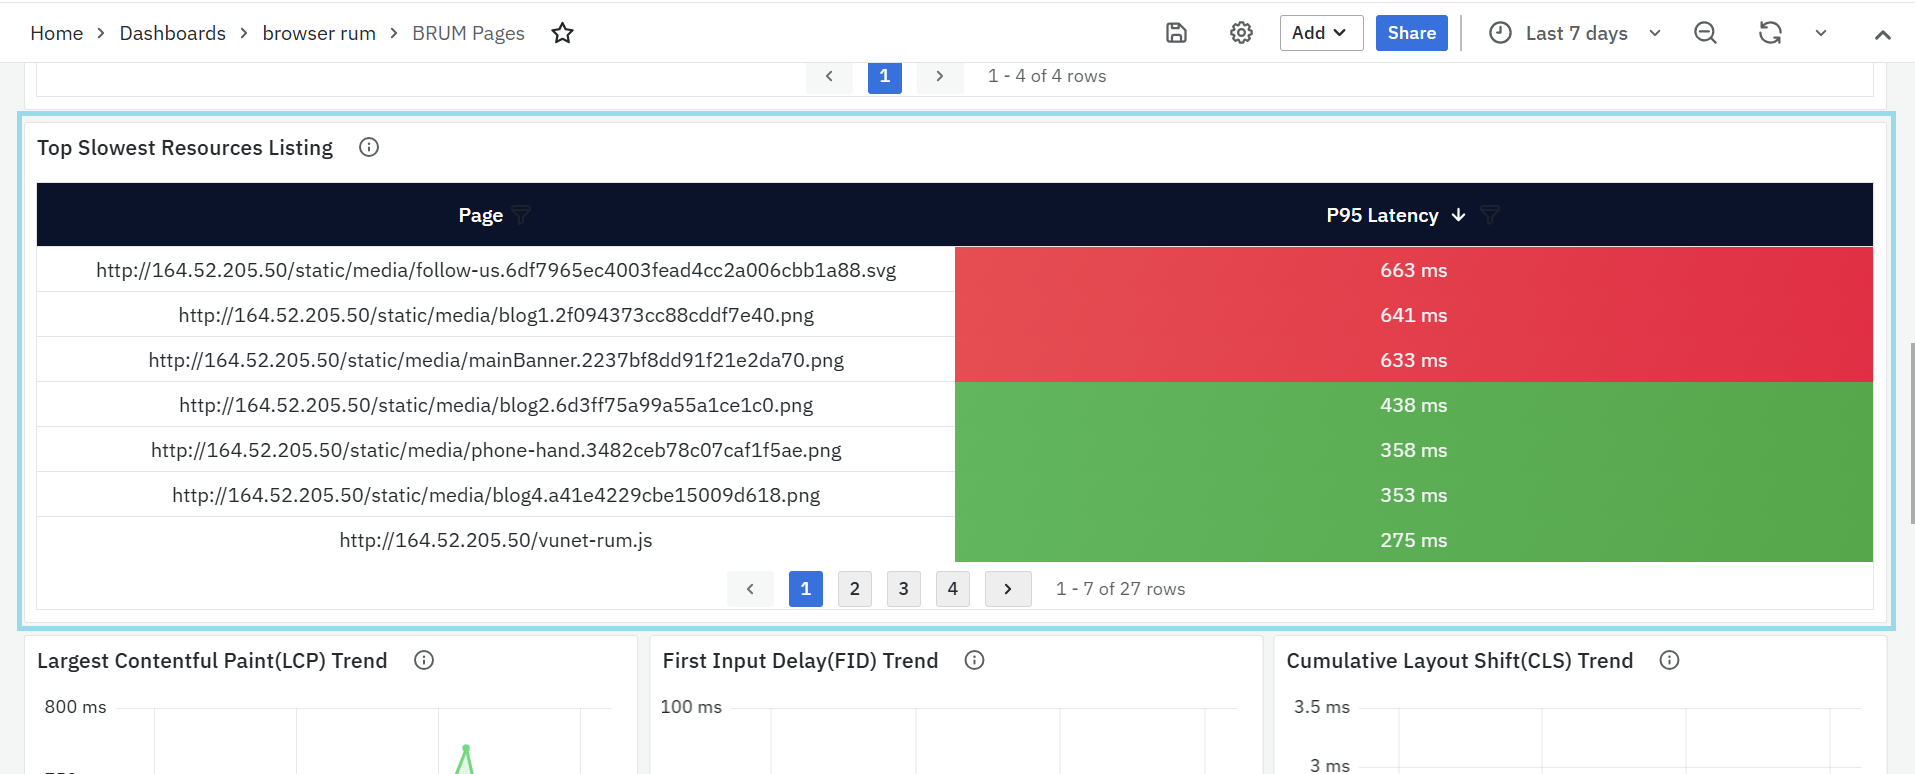
Identifies the slowest resources contributing to poor page performance.
- The Page column lists the resource URL.
- The P95 Latency column displays the time taken to load 95% of requests.
Largest Contentful Paint (LCP) Trend

This panel tracks how long it takes for the largest visible element (such as an image or text block) to load. A graph represents LCP trends over time, showing changes in performance across different dates. A consistently high LCP value suggests slow-loading content, requiring optimization to improve user experience.
First Input Delay (FID) Trend
This panel measures how quickly the page responds to the user interaction, such as clicking a button or typing in a form. A graph illustrates FID trends over time, highlighting variations in response times. A high FID means users experience delays in interaction, which can be caused by heavy scripts blocking the browser from responding quickly.
Cumulative Layout Shift (CLS) Trend
This panel visualizes the unexpected movement of page elements during loading, which can disrupt user experience. A graph represents CLS scores over time, helping teams track stability across different periods. A high CLS value indicates frequent shifts in content, which can make navigation frustrating.
Top Pages by CLS

This panel lists pages with the highest Cumulative Layout Shift (CLS) scores, helping teams identify which pages have the most unstable layouts.
- The URL column includes clickable links that direct users to the BRUM Tracelisting (Pages) Dashboard.
- The CLS column displays the shift score, with higher values indicating more significant visual instability.
Top Slowest FID Pages
This panel identifies pages with the longest First Input Delay (FID), helping teams improve interaction responsiveness.
- The URL column contains clickable links that lead to the BRUM Tracelisting (Pages) Dashboard.
- The FID column shows the time delay in milliseconds, representing the lag between a user action and the browser’s response.
Pages with high FID scores need optimization to enhance interactivity and reduce delays.
Top LCP Pages
This panel displays pages with the slowest Largest Contentful Paint (LCP) times, indicating slow-loading content.
- The URL column includes clickable links leading to the BRUM Tracelisting (Pages) Dashboard.
- The LCP column shows how long it takes for the largest page element to load, with higher values suggesting performance issues.
Optimizing LCP can reduce perceived load time and improve user experience.
BRUM API's
The BRUM API's provides detailed insights into API performance, errors, and latency, enabling efficient monitoring and troubleshooting. It includes the Latency Histogram, which visualizes API response time distribution, and Top Error Codes, displaying frequently encountered errors. The Slow APIs Listing highlights APIs with high response times, while the Event Sequence Timings panel breaks down the request lifecycle to pinpoint delays. The Error APIs Listing helps track APIs with recurring failures for quick resolution. Users can filter data based on Application, API, Browser, and OS with dropdown options to refine the analysis as needed.

BRUM API's Panels
Latency Histogram
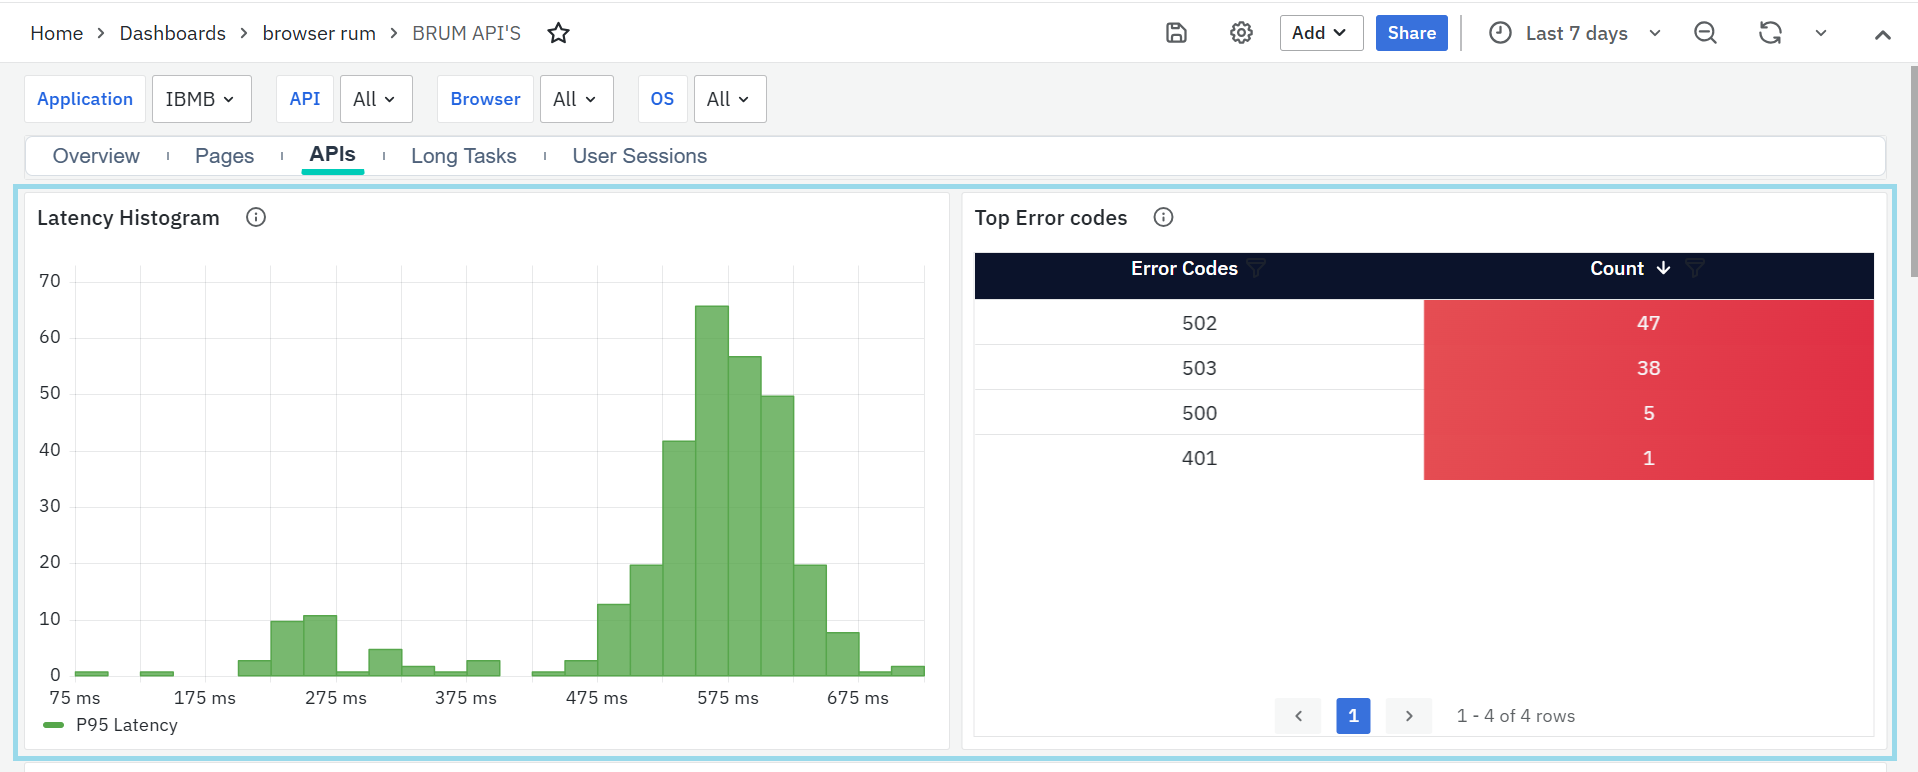
The Latency Histogram visualizes the distribution of API response times, helping identify performance trends and delays. It highlights the 95th percentile (P95) latency, which represents the response time below which 95% of API requests are completed. Monitoring this metric helps in detecting slow API responses and optimizing performance.
Top Error Codes
This panel displays the most frequent error codes encountered in API responses, along with their occurrence count.
- Error codes indicate issues such as client-side errors or server-side failures.
- Count indicates the number of errors occured.
This panel helps diagnose recurring issues, allowing teams to prioritize and resolve them efficiently.
Slow APIs Listing

The Slow APIs Listing identifies APIs with high response times, allowing users to analyze and optimize them. It includes the following details:
- API: A clickable link that redirects to the BRUM Tracelisting (API's) Dashboard, where detailed traces of the API can be examined.
- Request Count: The number of times the API was requested.
- P95 Latency: The response time at which 95% of the API requests are completed, highlighting slow responses.
Event Sequence Timings

The Event Sequence Timings panel presents a step-by-step breakdown of an API request lifecycle. Each stage is represented with its respective time taken, helping users identify where delays occur. The key stages include:
- DNS Resolution: Time taken to resolve the domain name.
- TCP Connection: Duration for establishing a connection with the server.
- SSL Handshake: Time required to complete the secure connection process (if applicable).
- Request Sent: Time taken to send the request to the server.
- Response Received: Time taken for the server to return a response.
- Processing Time: Duration for the server to process the request before responding.
This breakdown assists in pinpointing performance issues in API interactions.
Error APIs Listing

The Error APIs Listing provides a summary of APIs that frequently return errors, enabling quick identification of failing services. It includes:
- API: A clickable link that leads to the BRUM Tracelisting (API's) Dashboard for further investigation.
- Request Count: Number of times the API request resulted in an error.
- P95 Latency: Response time at the 95th percentile for failed requests.
This panel helps in tracking and troubleshooting API failures, ensuring improved reliability and stability.
BRUM Long Tasks
The BRUM Long Tasks focuses on identifying and analyzing tasks that take a long time to execute, potentially affecting application performance.Users can refine the displayed data using filters for Application, Page, Browser, and OS, each available as a dropdown for targeted analysis.
BRUM Long Tasks Panels
List of Long Tasks

This panel provides a detailed view of long-running tasks, helping users detect performance bottlenecks.
- Page: A clickable link that redirects to the BRUM Tracelisting (Pages) Dashboard, where detailed traces can be examined. Where users can explore up to 1000 most recent traces for the selected applications, services, and transactions.
- Request Count: The number of times the task was executed.
- P95 Latency: The response time below which 95% of requests are completed.
- LCP (Largest Contentful Paint): Time taken for the largest visible content to load.
- FID (First Input Delay): Measures the delay in processing the first user interaction.
- CLS (Cumulative Layout Shift): Represents visual stability by measuring unexpected content shifts.
This dashboard helps in identifying slow tasks, improving user experience, and optimizing performance.
Long Tasks Traces

This panel displays the most recent 1,000 traces related to long-running tasks for the selected applications and pages. It helps identify performance issues by offering trace-level visibility into user requests.
- Trace ID: Clickable link to the BRUM Tracelisting (Pages) Dashboard for a visual trace breakdown.
- Span ID: Identifies specific operations within a trace.
- Resource: Indicates the resource involved (e.g., page or endpoint).
- Duration: Total time taken for the full user request.
- HTTP Status: HTTP response code returned.
- Status: Shows if the trace succeeded or failed.
- Start Time: Timestamp marking when the trace began.
This panel enables quick identification of slow or error-prone tasks impacting performance.
BRUM User Sessions
The BRUM User Sessions provides a comprehensive view of user sessions, helping teams analyze engagement, performance, and errors. It includes key metrics such as the total session count, sessions with page or API errors, and session trends over time. Performance insights are offered through panels like P95 session duration, session counts by browser and OS, and top sessions by errors and latency. These insights help in identifying frontend and backend issues, optimizing response times, and ensuring cross-platform compatibility. Additionally, users can refine their analysis using dropdown filters for Application, Browser, and OS to focus on specific data as needed.
BRUM User Sessions Panel
Number of Sessions
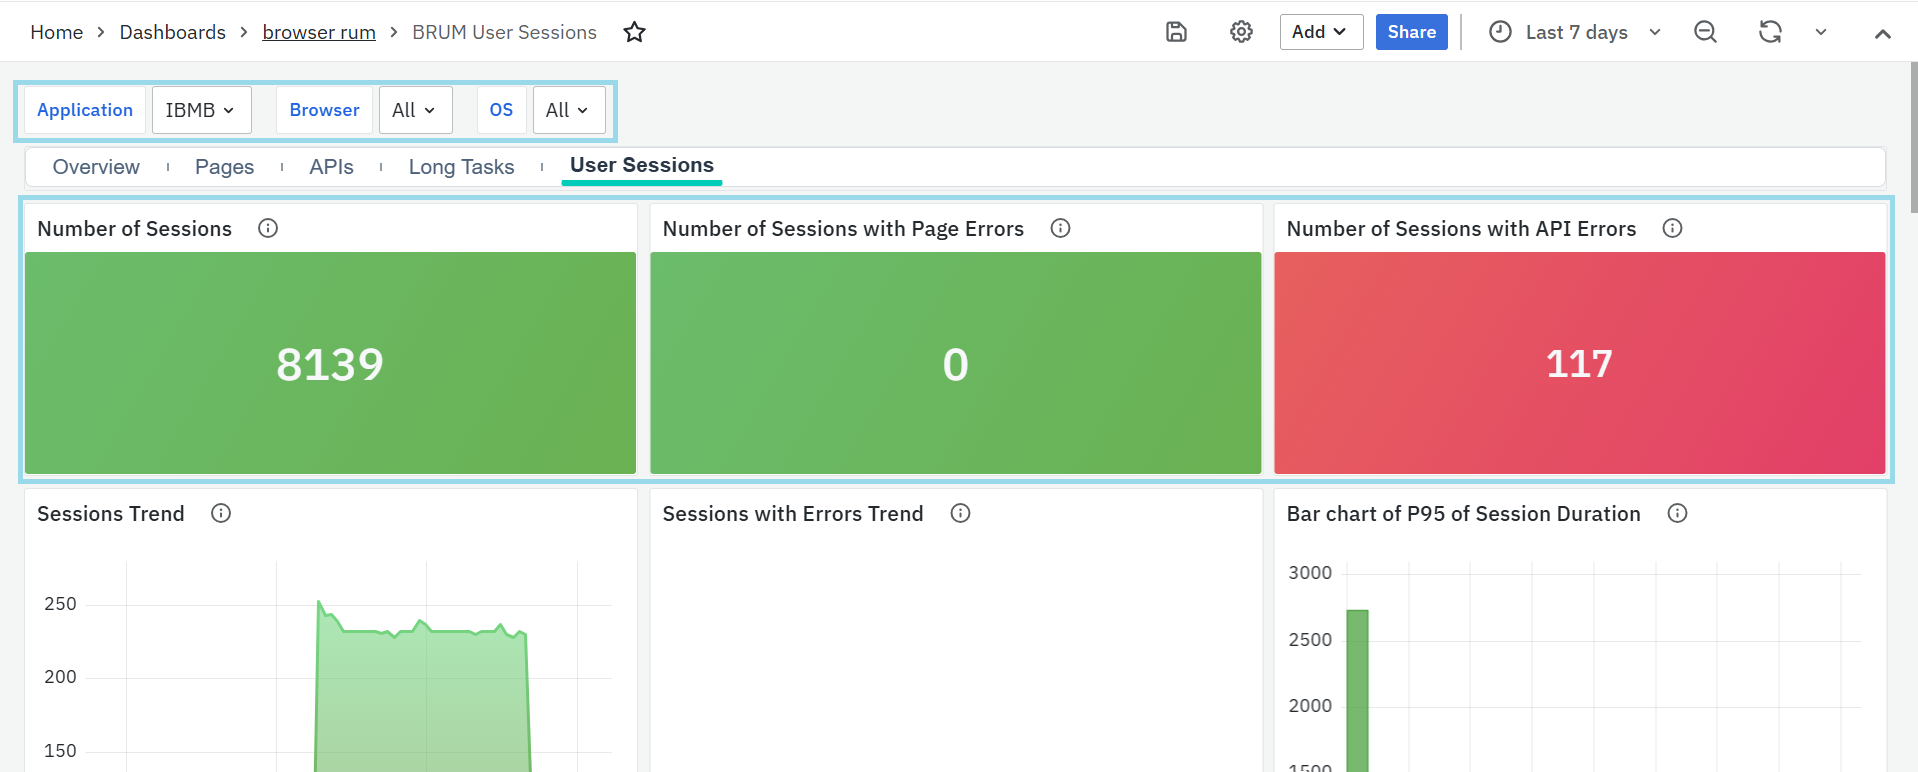
This panel displays the total number of user sessions recorded in the system. A session represents a user's interaction with the application within a specific timeframe. Monitoring this count helps in understanding user engagement and traffic patterns.
Number of Sessions with Page Errors
This panel tracks sessions that encountered page-related errors, such as missing elements, rendering issues, or loading failures. Identifying these sessions helps in diagnosing frontend problems affecting user experience.
Number of Sessions with API Errors
This panel displays the number of sessions where API failures occurred. It helps in detecting backend issues, slow responses, or API timeouts impacting user interactions.
Sessions Trend

This panel provides a graphical representation of session trends over time, showing the total session count. It helps in analyzing traffic fluctuations, peak usage times, and identifying anomalies in user activity.
Sessions with Errors Trend
This panel visualizes the trend of sessions that encountered errors, allowing teams to track error occurrences over time. It helps in identifying recurring issues and evaluating the impact of system updates or changes.
Bar Chart of P95 Session Duration
This panel presents a bar chart representing the 95th percentile (P95) session duration, which highlights the time taken for 95% of sessions to complete. It helps in assessing overall session performance and detecting unusually long user interactions.
Top 100 Sessions listing

This panel displays the top 100 user sessions, enabling teams to quickly identify and explore sessions of interest. It consists of the following columns:
- Session ID: A unique identifier for each session. It is a clickable link that redirects to the BRUM User Session Details Dashboard for deeper analysis.
Session Start Time: The timestamp indicating when the session began. - Session End Time: The timestamp indicating when the session ended.
- OS: The operating system used during the session.
- Browser: The browser used to access the application during the session.
This panel helps teams drill down into detailed session data for performance monitoring, behavioral analysis, and troubleshooting.
Sessions by Top 10 Browsers

This panel shows the number of unique user sessions grouped by browser name (e.g., Chrome, Firefox). Use this to identify the most commonly used browsers among your users.
Page Errors by Top 10 Browsers
Displays sessions with page-level errors, grouped by browser. Use this to detect which browsers are most often associated with frontend issues and prioritize fixes accordingly.
API Errors by Top 10 Browsers
Shows sessions that experienced client-side API errors, grouped by browser. Use this to investigate browser-specific failures in API calls and improve client-side compatibility.
Sessions Count per OS
Displays the total number of sessions segmented by operating system (e.g., Windows, Linux). Use this panel to understand which platforms your users are primarily accessing your application from.
Page Errors by Top 10 OSs
Shows the number of sessions that encountered page errors, grouped by OS. Helpful for identifying which platforms may be more prone to rendering or interaction issues.
API Errors by Top 10 OSs
Displays the number of sessions with API errors grouped by OS. Use this panel to spot OS-specific issues that might be affecting backend communication.
Session count per Browser
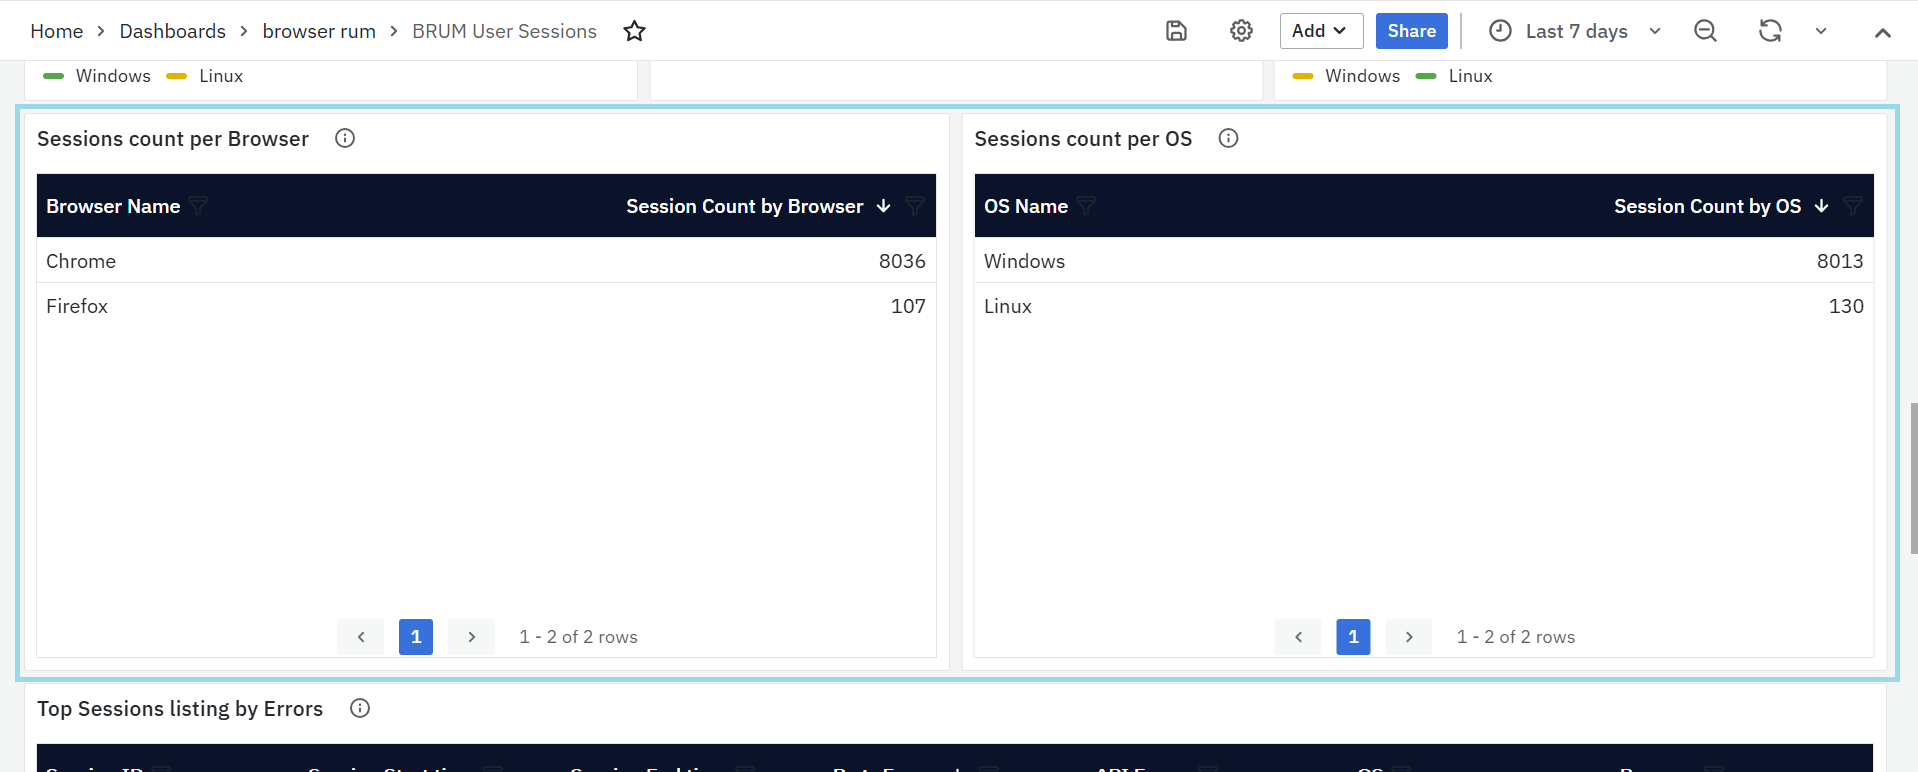
Displays the number of user sessions categorized by browser type. It includes:
- Browser Name: The name of the browser used in the session (e.g., Chrome, Firefox).
- Session Count by Browser: The number of sessions associated with each browser.
This helps in analyzing browser-specific performance issues and ensuring cross-browser compatibility.
Session count per OS
Displays the number of user sessions categorized by the operating system. It includes:
- OS Name: The operating system used during the session (e.g., Windows, Linux, macOS).
- Session Count by OS: The total number of sessions for each operating system.
This panel helps in identifying OS-specific performance or compatibility issues.
Top Sessions Listing by Errors

This panel displays sessions with the highest number of errors, helping identify critical user experience issues. It consists of the following columns:
- Session ID: A unique identifier for each session. It is a clickable link that redirects to the BRUM User Session Details Dashboard for further investigation.
- Session Start Time: The timestamp indicating when the session began.
- Session End Time: The timestamp indicating when the session ended.
- Page Errors: The number of errors encountered while loading or interacting with web pages during the session.
- API Errors: The number of API failures that occurred within the session.
- OS: The operating system used during the session.
- Browser: The browser used to access the application during the session.
This panel helps in identifying problematic sessions with high error rates, allowing teams to troubleshoot frontend and backend failures.
Top 10 Sessions Listing by Latency
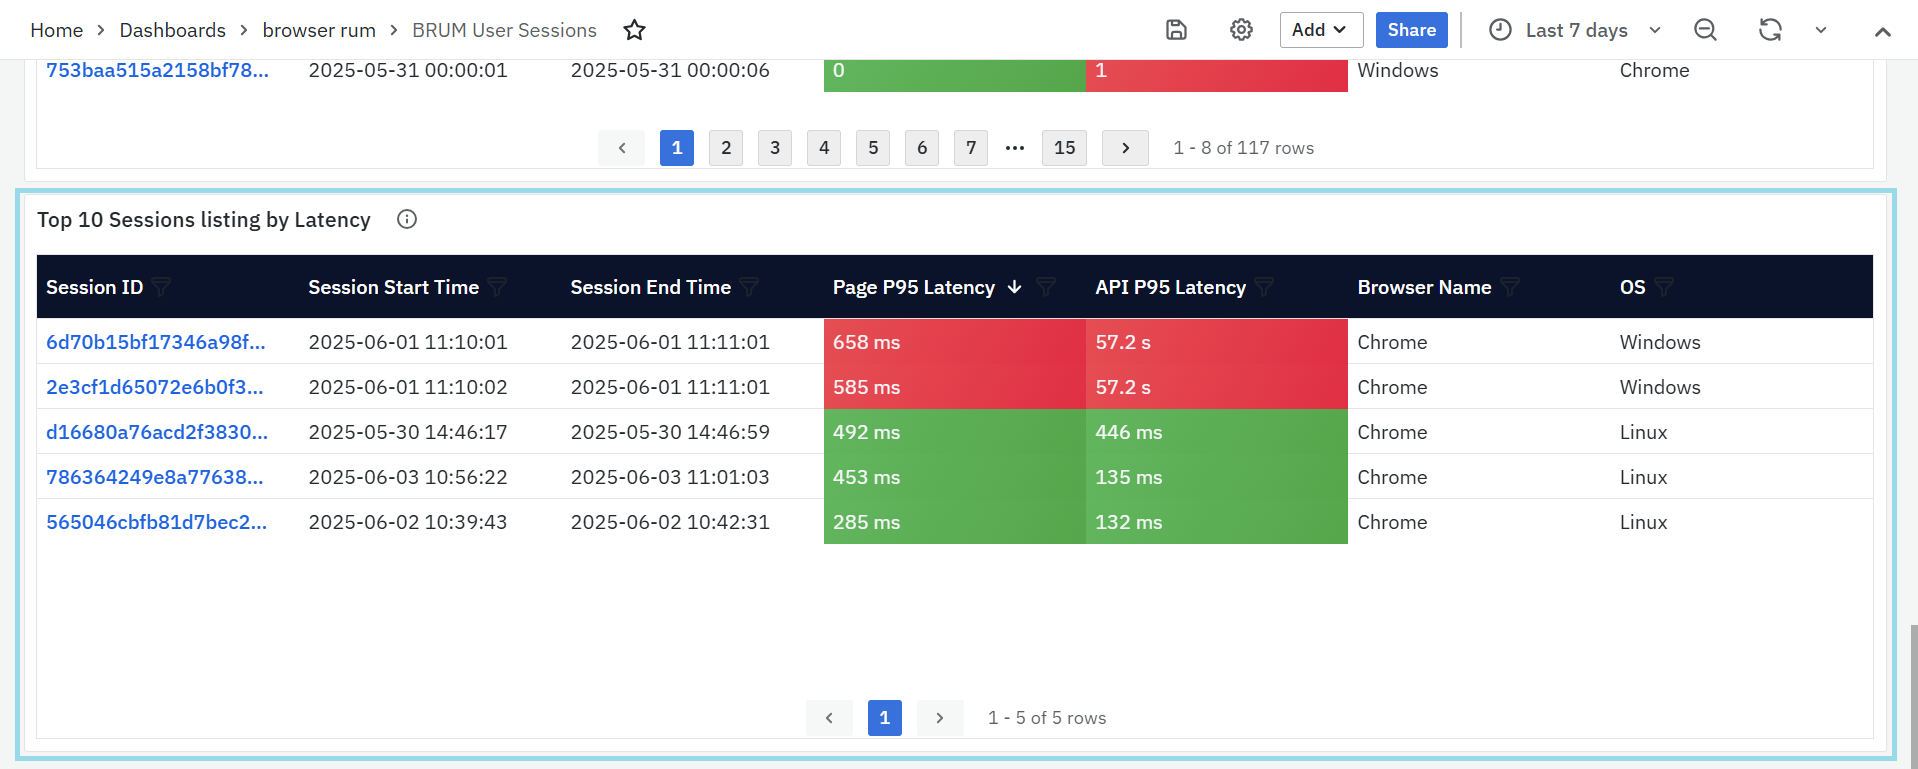
This panel highlights the top 10 sessions with the highest latency, helping teams identify performance bottlenecks. It includes the following columns:
- Session ID: A unique identifier for the session. Clicking on it redirects to the BRUM User Session Details Dashboard for in-depth analysis.
- Session Start Time: The timestamp when the session started.
- Session End Time: The timestamp when the session ended.
- Page P95 Latency: The 95th percentile latency for page load times within the session. This metric helps in assessing page performance for most users.
- API P95 Latency: The 95th percentile latency for API response times within the session, helping detect slow backend responses.
- OS: The operating system used during the session.
- Browser: The browser used during the session.
This panel helps teams analyze slow-performing sessions, optimize response times, and enhance user experience by resolving latency issues.
Tracelisting Dashboards
The Tracelisting Dashboards provide detailed insights into the performance of user requests across applications, services, pages, and APIs. These dashboards help teams track the lifecycle of traces and identify performance or issues. With customizable filters such as Application, Trace ID, HTTP Status Code, Host Name, and Page/API, users can refine the data to focus on specific traces for deeper analysis. The dashboards display essential trace details, including Trace ID, Span ID, Duration, HTTP Status, and more, offering a comprehensive view of request performance. This enables teams to quickly identify issues, optimize response times, and ensure a seamless user experience.
BRUM Tracelisting (Pages)
The BRUM Tracelisting (Pages) provides detailed insights into individual traces for the selected applications, services, and transactions. This dashboard helps in tracking the performance of specific user requests and offers visibility into each trace's lifecycle. It presents a structured view to analyze page performance, with customizable filters that allow you to refine the data based on Application, Trace ID, HTTP Status Code, Host Name, and Page. These filters help teams focus on the most relevant data, making it easier to identify performance issues and optimize the user experience.

All Traces (Pages)
This panel displays individual traces related to the selected filters. It shows the most recent 1,000 traces for the chosen applications, services, and transactions. Each trace represents a user request, and the panel includes the following key details:
- Trace ID: A unique identifier for the trace, which serves as a link to the BRUM Trace Map (Pages). This trace map provides a detailed, visual representation of the trace's flow, helping users identify the source of performance issues quickly.
- Span ID: This identifier represents a sub-transaction or part of a trace. It is crucial for understanding how different operations within a trace relate to each other.
- Resource: Represents the resource being loaded or interacted with during the trace, such as a page or document. It helps to see what part of the page or service the trace pertains to.
- Duration: The total time taken for the entire user request to complete. It indicates how long the trace took from start to finish and is essential for evaluating performance efficiency.
- HTTP Status: Displays the HTTP status code associated with the trace. This helps users quickly understand whether the request was successful or if there were any errors.
- Status: Indicates whether the trace was successful or failed. A “Success” status signifies that the trace completed without errors, while a failure status indicates issues that need investigation.
- Start Time: The timestamp indicating when the trace began. This is useful for time-based analysis, helping teams correlate trace data with external events or changes.
- Host Name: The server or environment where the trace originated. This helps users focus on specific servers or hosts, assisting in isolating issues related to particular infrastructures.

Together, these panels and filters provide an in-depth view of user interactions, helping teams track and resolve performance issues at the page level. By focusing on specific traces, users can pinpoint slowdowns, errors, and other performance anomalies, ensuring a seamless user experience.
BRUM Tracelisting (API's)
The BRUM Tracelisting (APIs) provides comprehensive insights into individual traces for selected applications and APIs, helping teams track the performance of user requests and interactions with API endpoints. This dashboard allows for a deep dive into the lifecycle of API calls, presenting a structured view of trace details that assist in identifying performance issues and optimizing response times. You can customize the displayed data using filters such as Application, Trace ID, HTTP Status Code, Host Name, and API. These filters help narrow down the results based on specific parameters, allowing for focused analysis and troubleshooting.

All Traces (APIs)
This panel displays individual traces related to the selected applications and APIs. It shows the most recent 1,000 traces for the chosen applications and APIs. Each trace corresponds to a user request, with the following key details:
- Trace ID: A unique identifier for the trace, which links to the BRUM Trace Map (APIs). This trace map offers a visual breakdown of the trace's flow, helping users quickly identify the source of performance issues.
- Span ID: This identifier represents a sub-transaction or part of a trace, providing insights into specific operations within the trace. It helps teams understand how different actions in the API call are related.
- Method: This refers to the HTTP method used for the API call, such as GET, POST, PUT, or DELETE. It helps identify the type of operation performed during the trace.
- Duration: The total time taken for the API request to complete, from start to finish. This metric is crucial for assessing the performance of API calls and pinpointing potential delays.
- HTTP Status: Displays the HTTP status code associated with the trace, helping users determine whether the API call was successful or encountered issues.
- Status: Indicates whether the trace was successful or failed. A “Success” status indicates that the trace completed without any issues, while a failure status highlights potential errors that need to be addressed.
- Start Time: The timestamp when the trace started. This is useful for correlating trace data with external events or identifying specific time-based performance patterns.
- Host Name: The server or environment where the trace originated. This helps users focus on specific servers or hosts, assisting in isolating issues related to particular infrastructures.
Together, these details offer a clear view of API performance, enabling teams to monitor and optimize API response times and troubleshoot issues efficiently. The ability to filter traces based on specific criteria ensures that users can focus on relevant data to improve the overall user experience.
Trace Visualization Dashboard
BRUM Trace Map
The BRUM Trace Map offers a comprehensive, visual representation of a single transaction as it flows through various services and components within your system. By tracking each step, or "span," of the request's journey, it provides a clear view of how the request progresses, which services it interacts with, and the duration of each step. This helps teams identify delays, errors, or unusual patterns in the request processing, essential for diagnosing performance issues and understanding the dependencies and interactions within the application. The dashboard includes a customizable Trace ID filter, allowing you to specify the trace you wish to investigate, helping you zoom in on specific requests for detailed analysis.

Trace Map - [Selected Trace ID]
The Trace Map panel shows the detailed path of the request, highlighting the key components involved in the transaction. The visualization includes the following section:
- Span Name: Represents individual operations or actions within the trace, such as function calls or database queries. These spans are arranged hierarchically, reflecting the sequence of events in the request flow.
- Service: Indicates which application or microservice is responsible for a particular span, providing insight into which part of the system executed the operation.
- Start Time: The exact moment when each span began. This helps establish a timeline of events as the request travels through different system components.
- Exec (ms): The total execution time for each span, including time spent on dependent or child spans. It shows how long the operation took to complete, including any external service calls or database queries.
- Exec %: This is the percentage of the total trace duration that each span consumes. It highlights which span is consuming the most time within the entire request process.
- Self Exec (ms): The execution time of the span itself, excluding the time taken by child spans or dependent operations. It reflects the time spent on that specific operation alone.
- Self Exec %: The percentage of the total trace duration that is dedicated to the span’s own execution, excluding the time of any nested or dependent operations.
- HTTP Code: Represents the HTTP status code for spans involving HTTP requests or responses. It indicates the outcome of the HTTP operation, helping identify success or errors.
- Span Status: Reflects the overall outcome of the operation captured in the span. This indicates whether the operation was completed successfully or encountered an issue, regardless of the HTTP status code.
Together, these columns provide a detailed view of the trace, enabling users to visualize and analyze every step of the request’s lifecycle, identify potential performance issues, and optimize the user experience.
User Session Insights
BRUM User Session Details
The BRUM User Session Details provides a comprehensive analysis of individual user sessions, helping users monitor session activity, identify performance issues, and troubleshoot issues effectively. The dashboard includes filters for Application and Session ID, enabling users to focus on specific sessions for detailed examination.
BRUM User Session Details Panel
Pages
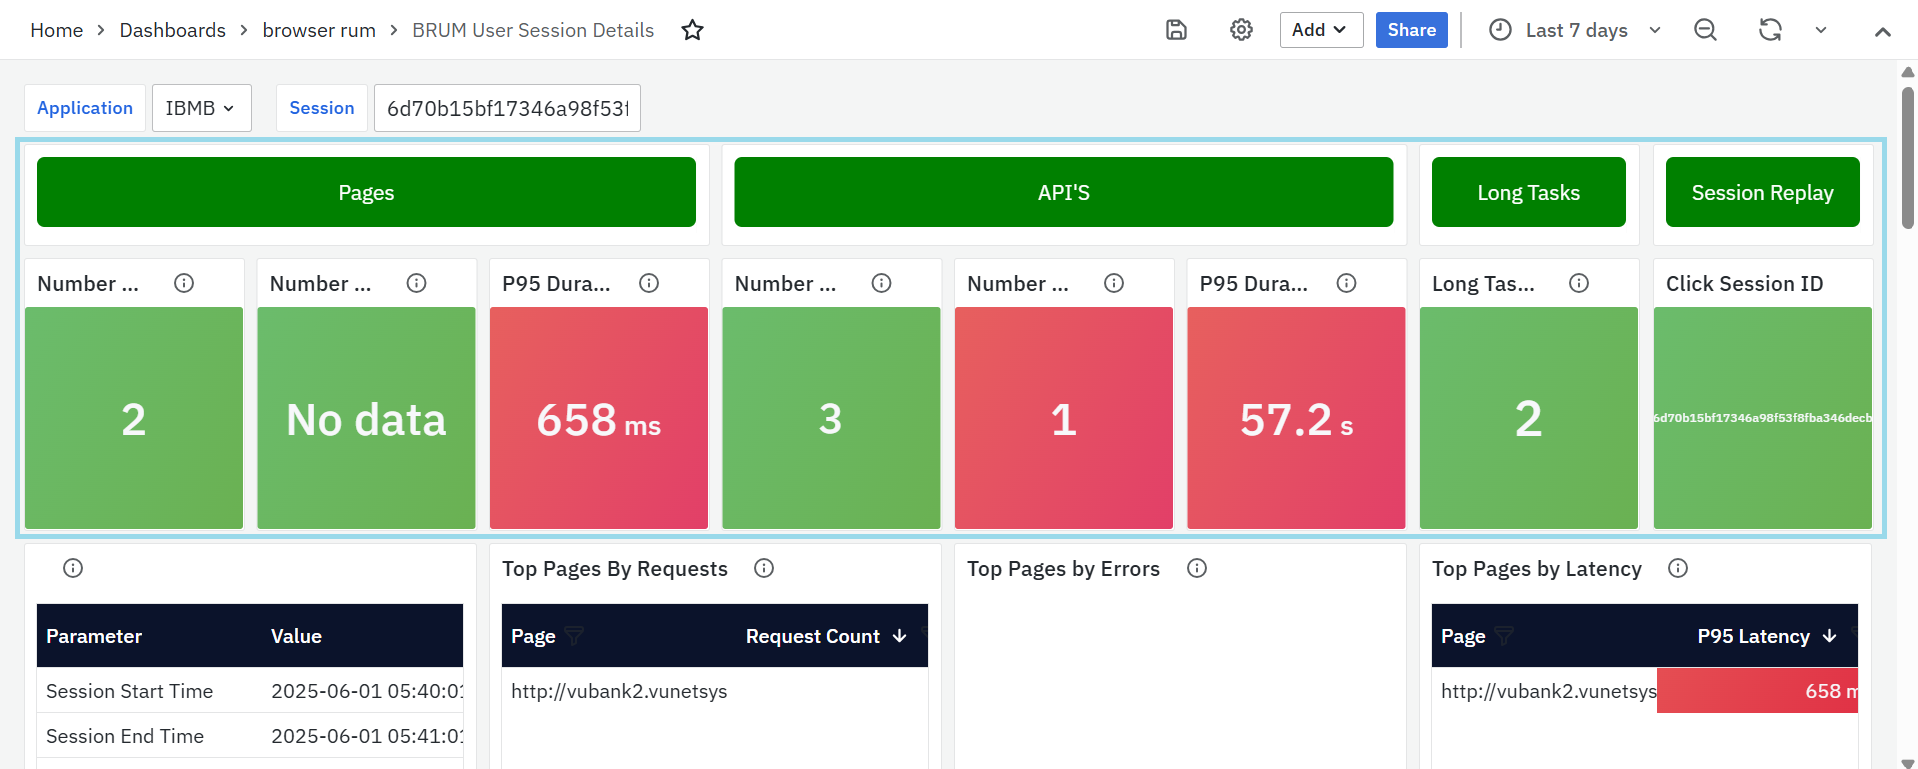
This panel provides an overview of page interactions within the session, highlighting key performance metrics:
- Number of Requests – The total count of page requests initiated during the session.
- Number of Errors – Displays the total number of errors encountered across all accessed pages.
- P95 Duration – Shows the 95th percentile page load time, identifying slow-loading pages that may impact user experience.
APIs
This section focuses on API interactions within the session, ensuring visibility into backend performance.
- Number of Requests – Indicates the total API calls made during the session.
- Number of Errors – Highlights the number of API-related errors detected.
- P95 Duration – Captures the 95th percentile API response time, helping identify performance issues.
Long Tasks
Long tasks can degrade the responsiveness of a web application by blocking the main thread. This panel helps identify such issues.
- Long Tasks Count – Displays the total number of long tasks detected during the session, providing a measure of application performance.
Session Replay
- This panel displays the Session ID as a clickable link that redirects to the Session Replay page.
- It allows you to view a visual replay of the user's actions during the session for better analysis and troubleshooting.

Session Replay Example:

Session Summary

This panel displays key metadata about the selected user session. It offers insights into the session’s timing, user environment, and geographic origin.
- Session Start Time – Timestamp when the session began.
- Session End Time – Timestamp when the session ended.
Duration – Total time span of the session, helping evaluate user engagement. - Operating System (OS) – User’s OS, useful for understanding platform-specific behavior.
- Country – Country from which the application was accessed.
- City – City-level location of the user session, aiding in regional performance insights.
- Browser Name – Browser used during the session, useful for browser-specific issue identification.
Top Pages by Requests
- This panel lists the most accessed pages during the session, ranked by the number of requests made.
- It helps identify which pages received the most user attention or interaction.
Top Pages by Errors
- This panel highlights the pages that experienced the highest number of client-side errors during the session.
- It is useful for quickly pinpointing problem areas impacting the user experience.
Top Pages by Latency
- This panel shows the pages with the highest response times, specifically at the 95th percentile.
- It helps identify performance bottlenecks that could lead to user dissatisfaction.
Pages & APIs
This section provides deeper insights into the most accessed pages and APIs, helping users understand usage trends, errors, and latency issues. This provides a Customization Options Where Users can configure data display preferences by clicking the settings icon next to the panel name. This opens a Row Options pop-up, where users can modify the Title and use the Repeat For dropdown to adjust data presentation dynamically for different applications or sessions.
User Actions
This panel provides a detailed breakdown of user interactions within a session. It captures navigations between application steps, specific user actions such as clicks, and their associated execution times. The table includes the following columns:
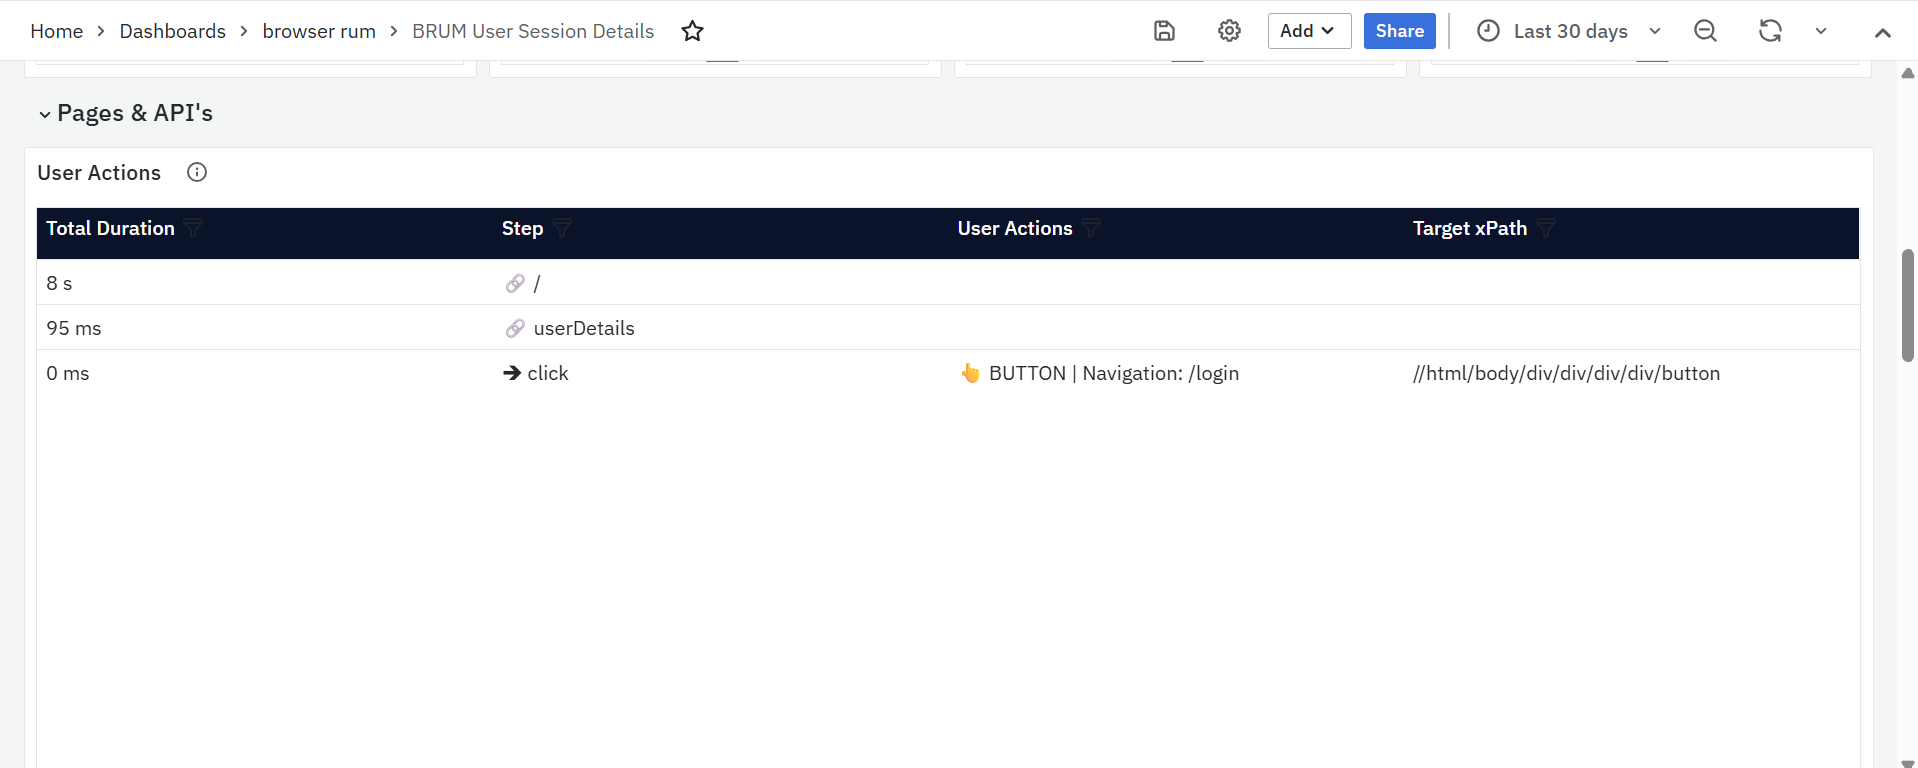
- Total Duration: The time taken to complete the action or step.
- Step: The application step or page where the action occurred.
- User Actions: The specific interaction performed by the user, such as a click or navigation, along with context (e.g., button click leading to a login page).
- Target xPath: The XPath of the target HTML element involved in the interaction, useful for pinpointing UI elements.
This panel helps in identifying how users interact with the application, detecting latency issues, and understanding the flow of actions during a session
Time Spent in a Page for a Session (in seconds)

This panel visualizes the user's navigation path within the session using a flame graph. It breaks down how long the user spent on each page, measured in seconds.
- Shows total session time and individual page durations.
- Helps identify where users spent most of their time during the session.
- The left-side table lists each page and its time values, while the right-side flame graph visually represents the page sequence and duration.
- Useful for understanding user engagement across different pages.
Top APIs by Request

This panel displays the most frequently accessed API endpoints during the session, based on the number of requests made.
- API – Displays the endpoint URL. This field is clickable and redirects to the BRUM Tracelisting (APIs) page for further analysis.
- Request Count – Indicates the number of times each API was called during the session.
Top APIs by Errors
This panel identifies API endpoints that encountered the most client-side errors during the session.
- API – Displays the endpoint URL. This field is clickable and redirects to the BRUM Tracelisting (APIs) page for deeper investigation.
- Error Count – Shows the number of errors captured for each API call.
Top APIs by Latency
This panel highlights the API endpoints with the longest response times, calculated at the 95th percentile.
- API – Displays the endpoint URL. This field is clickable and redirects to the BRUM Tracelisting (APIs) page for detailed latency traces.
- P95 Latency – Shows the 95th percentile latency for each API, representing the slowest responses experienced by users.
Long Tasks Analysis
This section provides insights into long tasks affecting page performance, ensuring users can detect and address delays effectively. This provides a Customization Options Where Users can adjust the panel settings by clicking the settings icon, opening the Row Options pop-up, where they can modify the Title and configure the Repeat For dropdown to tailor data presentation.

- Pages with Frequent Long Tasks – Lists pages that experience high long-task counts, with clickable links that lead to the BRUM Long Tasks Dashboard for further analysis.
- Long Tasks Trend – Provides a trend analysis of long tasks over time, helping detect performance regressions and application slowdowns.
This dashboard equips users with a detailed breakdown of user sessions, enabling proactive monitoring, performance optimization, and issue resolution.
Geographical Insights
Geo Map
The Geo Map provides a visual representation of user activity across different geographic locations, helping teams analyze performance metrics based on region. It allows users to identify patterns, detect regional performance issues, and optimize the user experience accordingly.

This dashboard includes zoom-in and zoom-out options, allowing users to explore data at different levels of granularity. Additionally, multiple filters help refine the data view:

- Application: A dropdown menu that allows users to select a specific application for analysis.
- Page: A dropdown menu for selecting specific pages to analyze their performance across regions.
- Browser: A dropdown filter that enables users to refine data based on different browsers.
- OS: A dropdown menu for filtering data based on operating systems.
By leveraging these features, teams can monitor regional performance variations.
