RCABot Storyboard

RCABot
RCABot is a crucial ready-to-use ML Model that can easily be configured for a business journey or individual application to:
- Provide an “Early Warning” signal based on the abnormality observed on any of the health and/or performance metrics related to configured components
- During incidents, enable the operations team to do faster resolution as the RCABot will precisely narrow down the problematic components, and golden signal and highlight the probable root cause
Type of Views in RCABot Storyboard
The RCABot storyboard view encompasses the overall state of a business journey/application at a specific point in time, and the view can be classified into three categories:


1. Incident View
This view indicates a business journey/application at a given point in time is in an impacted/unstable state. When a journey is in an “Incident” state, it signifies that issues or problems are occurring in the journey that are directly affecting the end-user experience. On the other hand, the users are not able to perform their transactions.
This state serves as an alert or warning that something is not functioning as expected, and it requires immediate attention. The storyboard view will:
- Pinpoint the specific lead indicators or key performance indicators (KPIs) that are affected which helps in understanding the scope and severity of the issue
- Provide a list of touchpoints, applications, or components that are unstable or experiencing problems and describe the Probable Root Cause
- Highlight the dependencies between the impacted component on the journey graph
- Finally, the recommended actions are shown based on the feedback and learning from the similar events in the past
2. Early Warning View
This state is a valuable aspect of journey observability, which is used to indicate an “Early Warning” sign for a journey at a given point in time. This state serves as a proactive indicator with the below characteristics:
- This state acts as an early indicator that there are elements within the journey such as touchpoints, applications, components, or golden signals that are showing signs of instability or problems
- Importantly, the end-user experience remains unaffected during this stage. This means that lead indicators or key performance indicators (KPIs) are still within acceptable ranges, and users are not yet experiencing issues
- The purpose of identifying these early warnings is to enable proactive actions to prevent potential issues from escalating and impacting the end-user experience
- The operation team can use this state to closely monitor the elements that are showing signs of instability and take preventive measures
3. Incident Analysis & Pattern Identification View
The storyboard extends the option for end-users to perform in-depth analysis, particularly in the context of historical incidents, and seamlessly achieve the below outcomes:
- Historical Incident Analysis: This capability is crucial for understanding the evolution of issues and their impact on the business journey.
- Understanding Hidden Patterns and Behaviors: By allowing detailed analysis, the platform facilitates the identification of hidden patterns and behaviors within historical incidents. This could involve recognizing trends, recurring issues, or anomalies that might not be immediately apparent without a thorough historical perspective.
- Focus on Golden Signals and Components: Golden signals often represent critical metrics, and understanding their historical behavior can provide insights into the overall health of the system. Similarly, understanding how different components (such as Network components, Infra components, and Application components) behave during incidents is valuable for diagnostics.
- Identifying Repetitive Nature of Issues: The platform aims to uncover the repetitive nature of issues. Recognizing patterns of recurrence is vital for anticipating and proactively addressing problems before they impact the business journey.
- Permanent Resolutions: The goal of this analysis is to identify permanent resolutions. Instead of merely addressing symptoms, understanding the historical context allows for root cause identification. Addressing root causes contributes to long-term solutions, enhancing the stability and performance of the business journey.
In summary, the RCABot storyboard provides valuable insights and actionable information for IT and business teams to monitor, manage, and optimize the end-to-end journey, ultimately improving user experiences and operational efficiency.
RCABot Storyboard
In this section, let us delve deeper into the richness of information and actionable insights available in the RCABot storyboard for user consumption:
Incident Overview Panel
Below is the overview panel, which shows the total number of active incidents, incidents cleared by users & Bot, and incidents closed by the users for the selected time window.
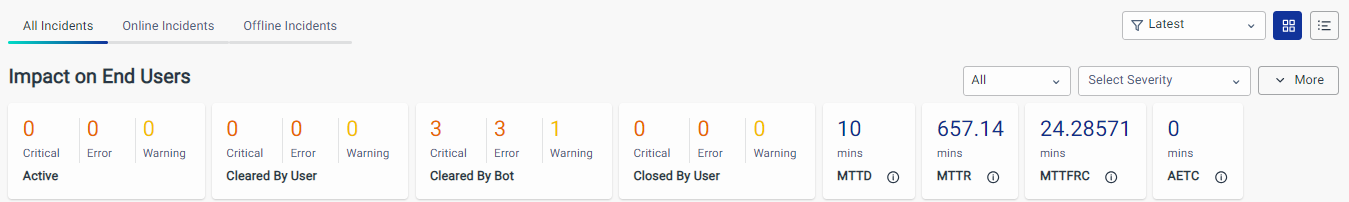
It also highlights the below metrics to measure the efficiency in identifying, resolving, and finding the root cause for incidents:
- MTTD: Mean time taken to Detect an incident
- MTTR: Mean time taken to Resolve incident.
- MTTFC: Mean time taken to find the Root Cause for incidents
- AETC: Average expected time to Clear incidents
Incident Card
An individual card for every incident will be displayed to summarize the below important information related to each of the incidents:
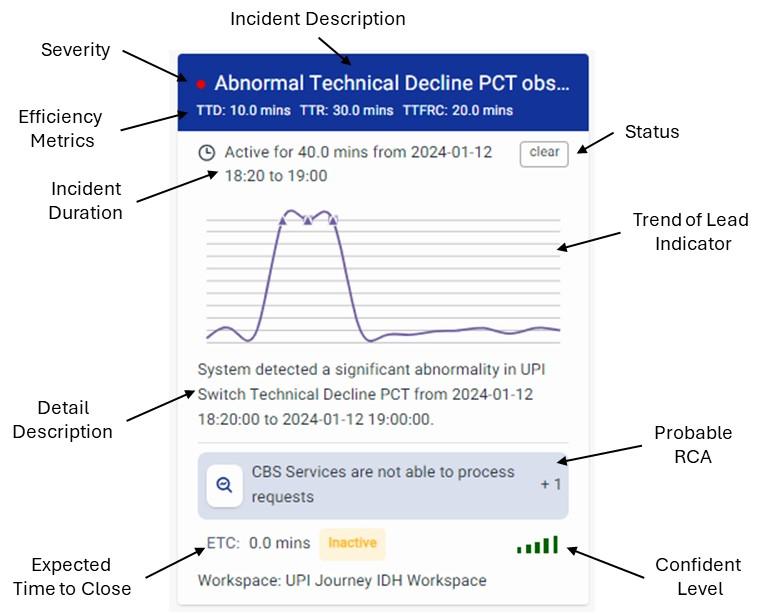
- The severity of the incident (Critical/Error/Warning).
- Brief incident description which precisely indicates the impacted/affected Lead Indicators.
- Metrics like TTD (Time taken to Detect), TTR (Time taken to Resolve) & TTFRC (Time taken to find Root Cause).
- Incident Status, Duration along with start and end time (if cleared) for the incident.
- Trend of impacted Lead Indicator.
- A detailed description of the incident.
- Probable Root Cause.
- Expected time to close (ETC) for the active incident.
- Confidence Level on reporting this incident.
The ![]() pagination option is available in the right bottom corner to view all the incidents.
pagination option is available in the right bottom corner to view all the incidents.
RCA Card
Once the user clicks on the “Incident Card,” an RCA card view will be shown below which highlights the list of probable root causes and other additional details for an incident


- List of impacted golden signals.
- List of Probable Root Causes.
- Dependency of impacted components using Journey graph, and Recommended Action.
- Options to Provide Feedback

- Options to share the details about the incidents using any configured communication channel

- Options to Create tickets and modify the workspace configuration
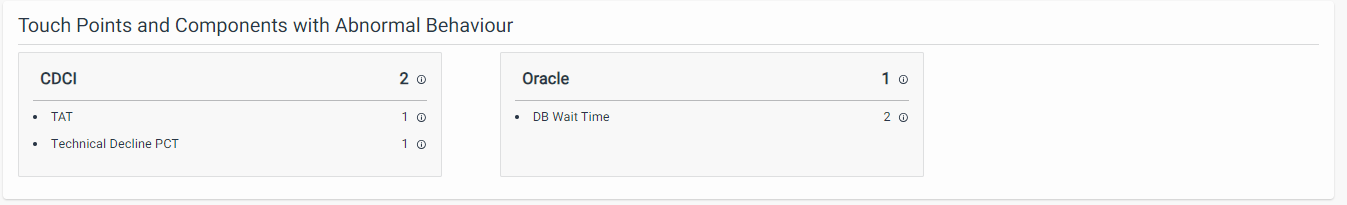
Summary Card
This view shows the list and trend for each of the impacted golden signals under each of the impact components

FAQs
What is RCABot?
- RCABot is an AI/ML-powered assistant that helps detect anomalies early and pinpoints the root cause during incidents in your business journey or application.
- It helps operations teams resolve issues faster with precise and contextual insights.
What are the different views available in RCABot Storyboard?
RCABot provides three powerful views to monitor and analyze application health:
- Incident View – Displays live incidents affecting user experience.
- Early Warning View – Flags early signs of potential issues before users are affected.
- Incident Analysis & Pattern Identification View – Helps analyze historical incidents, uncover patterns, and plan permanent resolutions.
What metrics are shown in the Incident Overview Panel?
This panel shows incident stats in a selected time window, including:
- MTTD (Mean Time to Detect)
- MTTR (Mean Time to Resolve)
- MTTFC (Mean Time to Find Cause)
- AETC (Average Expected Time to Clear) These help track operational efficiency.
What details are available in the Incident Card?
Each incident card provides a quick snapshot:
- Severity level (Critical, Error, Warning)
- Affected KPIs and their trends
- Time taken to detect, resolve, and identify cause
- Description, start/end time, and incident status
- Confidence level and expected time to close
Navigate to Incident Card for more details
What does the RCA Card contain?
This card appears when you select an incident. It includes:
- Probable root causes
- Impacted golden signals
- Component-level dependency graph
- Recommended actions
- Options to give feedback, share info, or raise a support ticket
Can I share incident details or create support tickets?
Yes! You can:
- Share incident summaries via configured channels (e.g., Slack, email)
- Create or link support tickets
- Modify workspace configurations
- Provide feedback for model improvement
What is shown in the Summary Card?
- It displays the overall trend and list of impacted golden signals across all affected components.
- This helps prioritize which services or systems need immediate attention.
