Browser Journey Monitoring
Introduction
In today's interconnected digital landscape, ensuring consistent and reliable user experiences across web applications is paramount. Introducing Synthetic Browser Journey Monitoring, a key component of vuSmartMaps designed to enhance your ability to oversee and optimize end-user interactions with web applications.
This solution leverages the power of Synthetic Browser Journey Monitoring to deliver a robust synthetic monitoring ecosystem. By simulating real user journeys through browser interactions, it captures and analyzes key performance metrics, errors, and screenshots, providing actionable insights into application behavior. With an automated workflow encompassing journey recording, enrichment, probe creation, and data visualization, Synthetic Monitoring streamlines the process from setup to execution.
This advanced system allows teams to proactively identify performance bottlenecks, ensure system reliability, and optimize web application delivery, all while presenting a seamless and intuitive interface. Whether tracking journey completion times or diagnosing errors at the granular level, Synthetic Monitoring empowers organizations to maintain exceptional digital experiences.
Getting Started with Synthetic Browser Journey Monitoring
Prerequisites
Before setting up a Synthetic Browser Journey using vuSmartMaps, ensure that your environment adheres to the following prerequisites. Once the probe is downloaded and started, it is expected to function as a standalone package and require no additional language runtimes or binaries to be installed. Only network connectivity and access to web journeys are needed.
-
Environment Access: The probe requires unidirectional access from the host machine (client machine/VM, Docker image, or Kubernetes pod) to:
- The Kafka instance to which it will publish instrumentation data. Ensure the Kafka broker port is open (default:
<<KafkaPorttobMentioned>>). - The target web application URLs that need to be monitored.
- The Kafka instance to which it will publish instrumentation data. Ensure the Kafka broker port is open (default:
-
Network Configuration:
- Kafka Port: Ensure the Kafka broker's port is open and accessible by the probe.
- Web Application Access: Confirm that the probe has direct network access to the web applications whose journeys are being monitored.
-
Platform Independence: The probe is designed as a standalone package with all dependencies bundled internally. It does not require any additional language runtimes or supporting binaries on the host machine.
-
vuSmartMaps Access: Synthetic Monitoring outputs are visualized through vuSmartMaps. Ensure that the vuSmartMaps platform is installed and operational to analyze journey insights and performance metrics effectively.
By meeting these prerequisites, you can seamlessly deploy and execute synthetic browser journey monitoring with minimal setup, ensuring robust observability and performance insights.
Understanding Synthetic Browser Journey Monitoring Technologies
Synthetic Browser Journey Monitoring is a proactive approach to evaluate and ensure the reliability, performance, and user experience of web applications. Simulating real user interactions enables organizations to identify potential issues before they impact actual users, ensuring optimal functionality at all times.
What is Synthetic Browser Journey Monitoring?
- Synthetic Browser Journey Monitoring involves simulating real user actions on a website using automated tools. These simulations replicate workflows such as logging in, browsing products, or completing transactions. By executing these journeys in a controlled environment, teams can monitor key performance metrics, identify bottlenecks, and preemptively resolve issues before they affect end-users.
- For example, consider an e-commerce website. Synthetic monitoring can simulate a user searching for a product, adding it to the cart, and checking out. During this process, the system measures page load times, checks for errors, and ensures the journey is completed successfully.
Why is Synthetic Monitoring important?
- Synthetic Monitoring helps ensure the consistent delivery of high-quality user experiences by identifying and resolving potential issues before users encounter them. It enables organizations to:
- Detecting performance bottlenecks in workflows.
- Monitor critical application functions like login, checkout, or data submission.
- Ensure uptime and availability for key services.
- Improve reliability and performance through continuous testing.
- Without Synthetic Monitoring, issues may go unnoticed until reported by users, potentially leading to a loss of trust and revenue.
What is a browser journey?
- A browser journey is a sequence of user actions performed within a web application, such as navigating pages, clicking buttons, filling out forms, and submitting data. These journeys represent typical use cases and are essential for ensuring that users can interact seamlessly with the application.
- For example, a banking application may have a browser journey where a user logs in, checks their account balance and transfers funds. Synthetic Monitoring tests these steps to ensure they work as expected and within acceptable timeframes.
How are browser journeys recorded?
- Browser journeys are typically recorded using vuSyntheticBrowserRecorder. These tools allow users to capture their interactions with the application in a script. The script is then enriched and enhanced to make it reusable for continuous monitoring.
- For example, a user might use the recorder to record the following steps:
- Navigate to a login page.
- Enter credentials.
- Click the login button.
- Verify successful login by checking for a specific element.
- These interactions are saved as scripts, which can be run repeatedly to monitor performance over time.
What is a probe?
- A probe is a self-contained executable package designed to run synthetic browser journeys. Probes include all necessary dependencies, such as the browser execution engine, configurations, and utilities, making them independent of the environment in which they are deployed. Probes are configured to:
- Execute browser journeys at scheduled intervals or on demand.
- Capture telemetry data such as performance metrics, errors, and screenshots.
- Send the captured data to Kafka for further processing.
- A key advantage of probes is their simplicity. Once downloaded, they don’t require any external software or binaries, reducing setup complexity. Probes only need network access to Kafka and the web application being monitored.
What data does the probe collect?
- Probes generate and collect detailed telemetry data, which provides insights into the performance and behavior of browser journeys. The collected data includes:
- Journey Duration: Total time taken to complete the journey.
- Response Times: Time required for individual steps, such as loading a page or clicking a button.
- Error Tracking: Details of HTTP errors or failed steps.
- Screenshots: Visual evidence of the application's state at key steps.
- This data is essential for identifying performance issues, monitoring trends, and ensuring smooth application functionality.
What happens to the collected data?
- The telemetry data captured by probes is sent to Kafka, a high-throughput messaging system. From Kafka, the data is:
- Processed by downstream systems for further refinement and storage.
- Visualized in dashboards on vuSmartMaps, which provide a comprehensive view of performance metrics, error logs, and screenshots.
- This multi-step pipeline ensures that data is not only stored but also made actionable for both technical and non-technical stakeholders.
What is telemetry, and why is it important?
- Telemetry refers to the data collected during the execution of synthetic browser journeys. It includes metrics, logs, and screenshots that describe the application's behavior and performance. Telemetry is vital because it:
- Provides objective insights into how the application performs under simulated conditions.
- Helps pinpoint performance bottlenecks, such as slow page loads or failed API calls.
- Enables trend analysis to predict and prevent future issues.
- By continuously collecting telemetry, teams can ensure the application meets user expectations and resolves issues proactively.
What tools are used in Synthetic Monitoring?
- The core technologies used in Synthetic Monitoring include:
- vuSyntheticBrowserRecorder: This is used to record and execute browser journeys.
- Kafka: For handling telemetry data transmission.
- vuSyntheticBrowserEngine: For intermediate data processing and caching.
- vuSmartMaps: For visualizing performance metrics and errors.
- These tools work together to create a robust and scalable monitoring ecosystem.
How does Synthetic Monitoring benefit businesses?
- Synthetic Monitoring provides several tangible benefits:
- Improved User Experience: By ensuring workflows are seamless and error-free.
- Proactive Issue Detection: Identifies problems before they affect end-users.
- Performance Optimization: Monitors and improves key workflows like logins, checkouts, and API transactions.
- Cost Efficiency: Reduces downtime and improves system reliability, minimizing operational costs.
What is the difference between Synthetic Monitoring and Real User Monitoring (RUM)?
- Synthetic Monitoring: Simulates user actions to test workflows in a controlled environment. It is proactive and works even when no users are active.
- Real User Monitoring: Captures and analyzes actual user interactions with the application. It is reactive and provides insights based on real-world usage patterns.
- Both approaches are complementary and often used together to achieve comprehensive observability.
What happens if a browser journey fails?
- When a browser journey fails during Synthetic Monitoring:
- The probe logs the error details, such as HTTP status codes or unexpected page elements.
- A screenshot of the failure is captured to aid in debugging.
- The error is sent to Kafka, where it is processed and highlighted in dashboards for immediate visibility.
- This process ensures teams can quickly investigate and resolve issues.
How are performance metrics visualized?
- Performance metrics are visualized in user-friendly dashboards, such as those provided by vuSmartMaps. These dashboards display:
- Success and failure rates for journeys.
- Step-by-step performance breakdowns.
- Error details with timestamps.
- Screenshots for visual validation.
- These visualizations make it easy for technical and non-technical stakeholders to monitor application health and identify issues.
Synthetic Browser Journey Monitoring Architecture
The architecture of Synthetic Browser Journey Monitoring is meticulously designed to deliver end-to-end observability for web applications. Integrating robust tools and workflows ensures seamless execution of browser journeys, efficient data processing, and actionable insights through visualization.
Key Components and Workflow
Journey Recording and Enrichment
- vuSyntheticBrowserRecorder: Users record browser journeys using this intuitive tool, which captures interactions and saves them as scripts
(<JourneyName>-init.js). These scripts represent real user workflows and form the foundation of synthetic monitoring. - Script Enrichment: Recorded scripts are enhanced by the system, generating enriched versions
(<JourneyName>-final.js). This process adds necessary instrumentation and prepares the scripts for automated execution.
Probe Creation
- The enriched scripts are bundled into a vuSyntheticBrowserProbe along with all required dependencies, including the vuSyntheticBrowserEngine and logging tools. This standalone executable ensures that the probe can operate independently, without requiring additional installations or configurations.
Probe Execution and Transmission
- The vuSyntheticBrowserProbe executes the browser journeys as scheduled or on demand. During execution:
- Telemetry Data is captured, including performance metrics, error logs, and screenshots.
- The probe includes a lightweight logging mechanism to transmit telemetry data to Kafka for downstream processing.
- Screenshots and other data outputs are sent securely to Kafka for storage and retrieval.
Data Processing
- The vuSyntheticBrowserEngine processes telemetry data to:
- Refine raw data for consistency and accuracy.
- Transform enriched data for storage and visualization.
- Manage real-time status updates to support quick issue identification and resolution.
Data Storage and Aggregation:
- Processed telemetry data is stored in a high-performance analytics database for efficient querying and visualization.
- The vuSyntheticBrowserEngine ensures streamlined data aggregation, making telemetry insights accessible for dashboards and reports.
Visualization and Analysis:
- vuSmartMaps Dashboards: Aggregated telemetry data is visualized in user-friendly dashboards, providing:
- Metrics for browser journey performance.
- Error details with visual aids (e.g., screenshots).
- Analytical reports for performance optimization and troubleshooting.
Detailed Architecture Description
vuSyntheticBrowserRecorder: This recorder simplifies journey creation by capturing user interactions in a browser environment. The resulting scripts serve as a blueprint for synthetic monitoring, ensuring every user action is documented with precision.
vuSyntheticBrowserProbe: The probe is a standalone, platform-independent package containing everything needed to execute browser journeys. It includes instrumentation tools, logging agents, and configurations, requiring only network access to Kafka and the web application.
Kafka and vuSyntheticBrowserEngine:
- Kafka: Acts as the primary message broker for telemetry data transmission, ensuring high throughput and reliability.
- vuSyntheticBrowserEngine: Processes telemetry data by refining it for consistency, managing the storage of screenshots and large data files, and providing real-time status updates for immediate visualization.
Visualization with vuSmartMaps: The dashboards aggregate data into detailed reports and charts, offering a step-by-step breakdown of browser journeys, metrics like completion times, error rates, and response times, along with interactive visualizations to pinpoint bottlenecks and optimize workflows.
Synthetic Browser Journey Monitoring Features
With Synthetic Browser Journey Monitoring, you gain unparalleled control over your web application's performance, ensuring that every user journey delivers a seamless and consistent experience. Monitor critical workflows, proactively address issues, and optimize performance to maintain a superior user experience.
Comprehensive Browser Journey Insights
- Monitor Critical Metrics: Track vital metrics like journey completion rates, step durations, errors, page load times, response times, and end-to-end journey durations.
- Simulate and Analyze User Journeys: Conduct simulations for key workflows like login, checkout, and form submissions to gain insights into performance variations across different environments.
- Proactive Error Identification: Detect failures or slowdowns at specific journey steps before they impact real users, and receive alerts for HTTP errors, failed actions, or unresponsive pages.
Real-Time Journey Visualization
- Interactive Journey Visualization: Visualize the real-time flow of user interactions across web pages and components, and leverage detailed step-by-step breakdowns to identify bottlenecks.
- Filters and Drill-Downs: Use intuitive filters to focus on specific steps, errors, or performance metrics, and drill down into individual journey steps to uncover the root causes of issues.
- High-Level Views for Stakeholders: Provide executives and CXOs with a bird’s-eye view of application reliability and performance, and Showcase metrics like journey success rates, errors, and delays in easy-to-understand formats.
Synthetic Monitoring for Complex Workflows
- Customizable Synthetic Journeys: Create and simulate complex user workflows that replicate real-world scenarios, customizing journey steps to align with business-critical use cases.
- Behavioral Insights: Understand how your application behaves under simulated user interactions and correlate telemetry data to gain a complete picture of journey performance and outcomes.
Instrumentation and Data Collection
- Integrated Instrumentation: Instrument browser journeys using the vuSyntheticBrowserRecorder to capture granular telemetry data, including page-level metrics, errors, and step-specific details during execution.
- Efficient Data Collection: Leverage the vuSyntheticBrowserProbe to collect telemetry without external dependencies, and aggregate the data through the vuSyntheticBrowserEngine for storage, processing, and analysis.
- Correlated Insights: Combine telemetry data with journey simulations to uncover patterns and dependencies.
Journey Dashboard and Reporting
- Dynamic Dashboards: View consolidated data on journey success rates, performance metrics, and error reports, while visualizing telemetry data alongside screenshots for better context during analysis.
- Customizable Alerts: Configure alerts for failures, delays, or errors in browser journeys. And Ensure timely responses to issues before they affect end-users.
- Detailed Reports: Generate actionable reports summarizing journey performance, errors, and optimization recommendations, and share insights across teams to foster collaboration and enhance operational efficiency.
Automation and Scalability
- Schedule and Automate Testing: Schedule synthetic journeys to run periodically, automating critical workflows to ensure continuous monitoring, uptime, and performance at scale.
- Scalable Architecture: Leverage a robust, scalable framework powered by Kafka, ClickHouse, and vuSmartMaps to monitor hundreds of browser journeys simultaneously without compromising performance.
Key Benefits
- Proactive Monitoring: Identify issues and bottlenecks before they impact real users by simulating user interactions to ensure consistent performance across workflows.
- Real-Time Observability: Gain end-to-end visibility into browser journey performance with live dashboards and receive immediate alerts for any failures or slowdowns during execution.
- Faster Resolution: Perform root cause analysis with detailed telemetry data and visual evidence to reduce mean time to resolution (MTTR) with actionable insights.
- Improved Stability and Reliability: Ensure all critical workflows are tested and optimized continuously to minimize downtime and improve overall application reliability.
- Enhanced Decision-Making: Use detailed insights and analytics to guide optimization efforts and provide stakeholders with clear, concise reports on performance metrics.
Synthetic Browser Journey Monitoring Console
Synthetic Browser Journey Monitoring Console, your centralized hub for comprehensive browser journey observability. The console is designed to empower you with real-time insights, and intelligent alerts, all seamlessly integrated into the monitoring ecosystem. With pre-packaged dashboards, alerts, and insights, the Synthetic Browser Journey Monitoring Console provides an out-of-the-box solution for optimizing browser workflows and ensuring a seamless user experience.
-
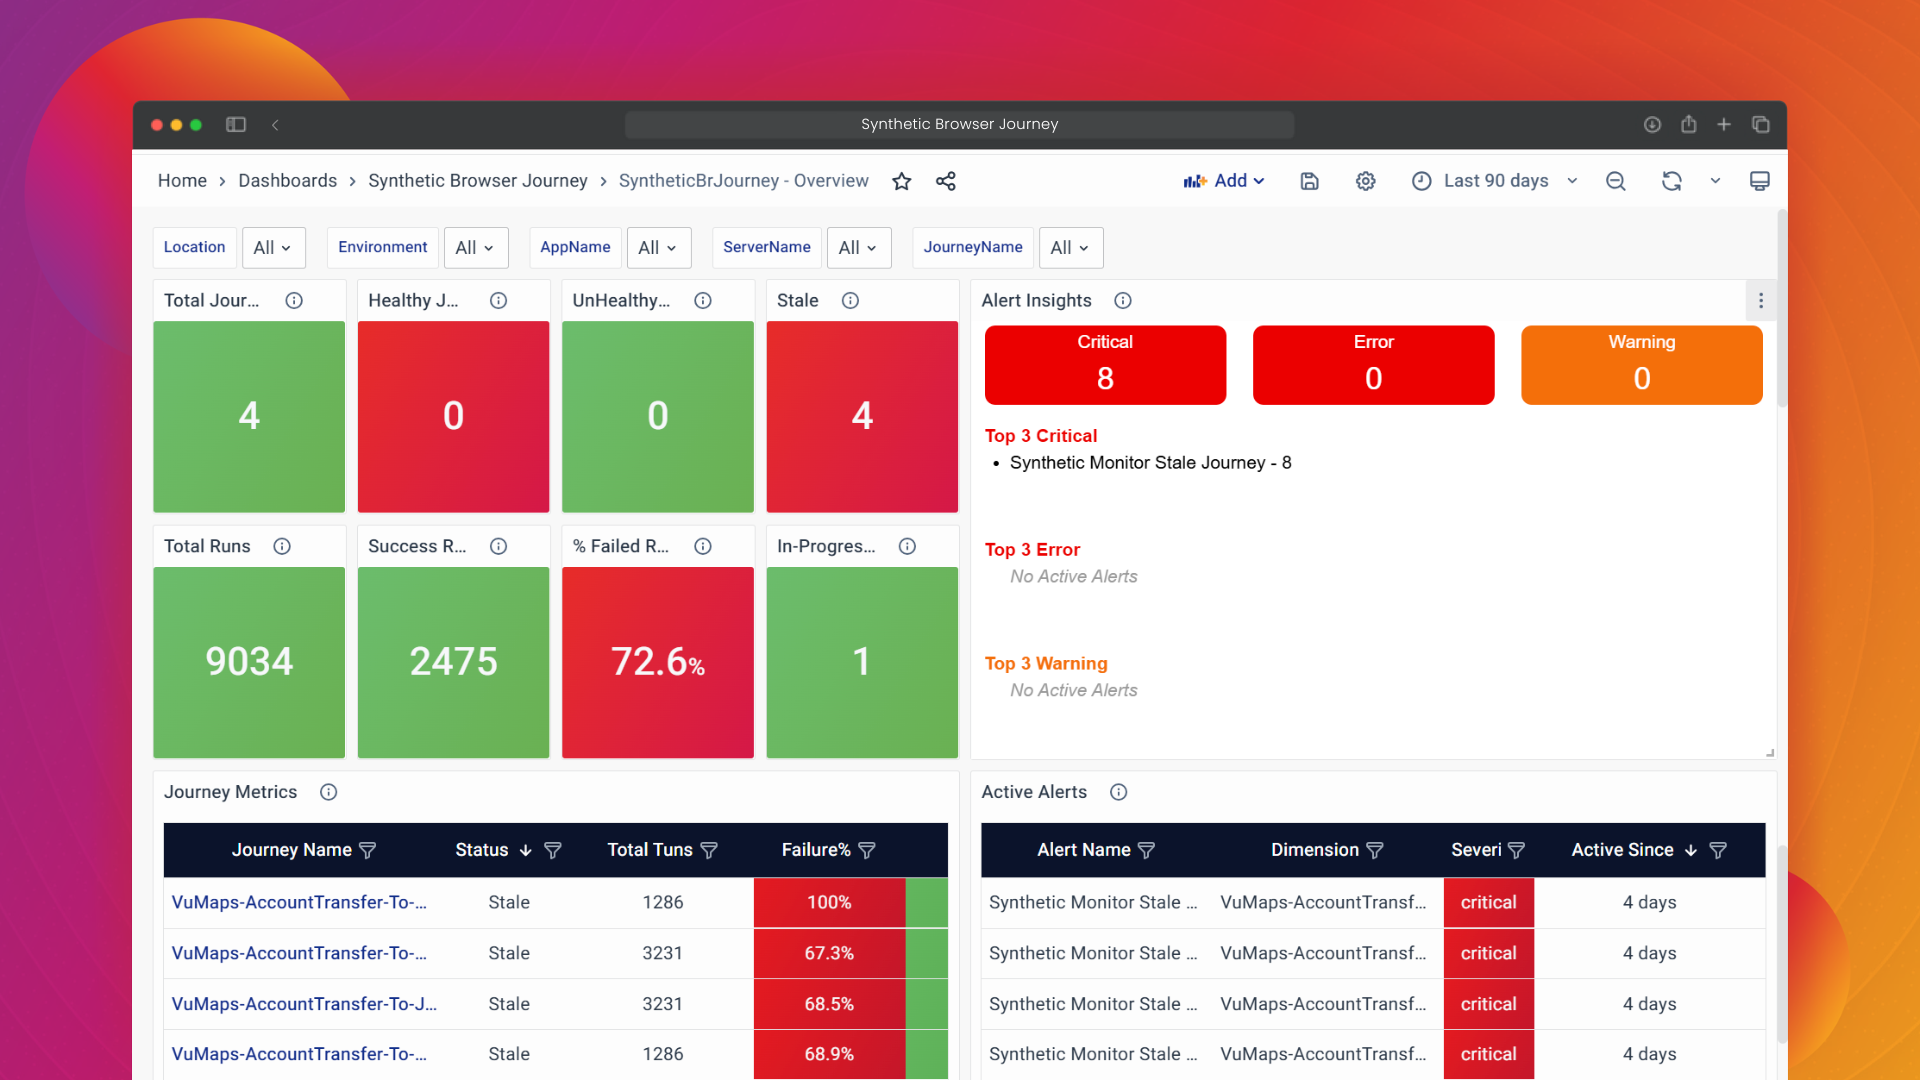
Synthetic Browser Journey Monitoring Dashboards: Navigate through intuitive dashboards that visually represent critical metrics, including journey success rates, which track the percentage of successfully completed user journeys, error rates that highlight steps with failures like HTTP errors or timeouts, and journey durations, allowing you to monitor both step-by-step and total execution times. Gain a holistic view of your web application's performance, identify bottlenecks at specific steps, and effortlessly track trends in browser journey metrics.
-
Synthetic Browser Journey Monitoring Alerts: Stay ahead of potential issues with intelligent alerts tailored for browser journey monitoring. Real-time notifications keep you informed of deviations such as failed steps, prolonged durations, or significant error rates, while customizable thresholds allow you to set performance benchmarks specific to your application. With proactive resolutions, you can respond promptly to alerts and resolve issues before they impact users. Our alerting system ensures uninterrupted monitoring, enabling teams to maintain the reliability of key workflows proactively.
The Synthetic Browser Journey Monitoring Console serves as your command center, providing a unified platform to navigate dashboards, respond to alerts, and access telemetry data. It enables the generation of insightful reports summarizing journey performance, trends, and optimization opportunities while offering tools to ensure consistent, reliable, and efficient user experiences across your browser workflows.
Synthetic Browser Journey Monitoring Real-world Applications
Synthetic Browser Journey Monitoring enables businesses to simulate, monitor, and optimize critical workflows across various industries, ensuring reliability, scalability, and exceptional user experiences. Below is a detailed and consolidated list of real-world applications, including advanced use cases such as Blue-Green Deployments and Version Upgrades.
-
Proactive Workflow Monitoring in E-commerce
An e-commerce platform simulates workflows such as user logins, product searches, and checkout processes. By running these simulations, the platform identifies delays or errors before users experience them, ensuring smooth shopping experiences during peak sales like Black Friday or flash sales.
-
Ensuring the Reliability of Online Banking Transactions
Synthetic Browser Journey Monitoring tests workflows like logging in, fund transfers, and balance inquiries in banking applications. It identifies and resolves transaction delays or failures, ensuring a seamless and reliable banking experience that fosters user trust.
-
Enhancing User Experience for Food Delivery Apps
Food delivery platforms simulate workflows from placing an order to tracking delivery. Monitoring ensures menus load quickly, payments are processed securely, and real-time tracking works reliably, even during peak meal times or weather disruptions.
-
Optimizing Gaming Platform Scalability
Gaming platforms simulate actions like player logins, multiplayer room creation, and in-game purchases. Monitoring during traffic surges ensures smooth gameplay, scaling resources effectively to prevent service disruptions during game launches or tournaments.
-
Monitoring Online Trading Platform Stability
FinTech companies simulate workflows like stock purchases, order placements, and payment processing. This ensures real-time execution and minimizes risks during critical trading hours, enhancing reliability and user confidence.
-
Improving Mobile Banking App Responsiveness
Synthetic Browser Journey Monitoring tests workflows in mobile banking apps, such as fund transfers, bill payments, and transaction history views. It ensures fast responses and error-free navigation, delivering superior user satisfaction.
-
Optimizing SaaS Application Performance
SaaS platforms simulate workflows like user registration, subscription management, and data exports. Monitoring helps identify and resolve bottlenecks, ensuring uninterrupted service as the application scales.
-
Securing Payment Gateways
Payment gateway applications test workflows like entering card details, OTP verifications, and processing transactions. Synthetic monitoring ensures fast and secure payment handling, reducing transaction failures and increasing user trust.
-
Boosting Retail Loyalty Programs
Retail platforms simulate loyalty program workflows, such as logging into accounts, redeeming points, and applying discounts. Monitoring ensures smooth and error-free usage, enhancing customer retention and engagement.
-
Monitoring Healthcare Appointment Systems
Healthcare platforms simulate workflows like booking appointments, accessing test results, and communicating with doctors. This ensures smooth operation and accessibility, especially during high-demand periods.
-
Streamlining Travel Booking Experiences
Travel websites simulate workflows such as searching for flights, booking tickets, and generating itineraries. Monitoring ensures quick responses and smooth booking experiences, even during holiday rush periods.
-
Ensuring Government Portal Accessibility
Government portals simulate workflows like applying for services, paying taxes, and submitting documents. Monitoring ensures seamless functionality during critical periods like tax filing deadlines.
-
Scaling Education Platforms During Exams
Online education platforms simulate workflows like logging into virtual classrooms, submitting assignments, and taking exams. Monitoring ensures smooth access and performance during critical times like exam weeks.
-
Maintaining Resilience for Retail Inventory Management
Retail platforms simulate workflows such as updating stock levels and placing supplier orders. Monitoring ensures that inventory systems operate smoothly during peak shopping seasons, preventing stockouts or delays.
-
Supporting Logistics and Supply Chain Applications
Logistics companies simulate workflows like scheduling deliveries, tracking shipments, and generating invoices. Monitoring ensures smooth operations, reducing delays and disruptions in supply chains.
-
Testing Subscription-Based Streaming Services
Streaming platforms simulate workflows like user logins, browsing content, and streaming videos. Monitoring ensures minimal buffering, fast content loading, and uninterrupted streaming during peak hours or live events.
-
Improving Airline Check-In Processes
Airline websites simulate workflows for checking in, selecting seats, and downloading boarding passes. Monitoring ensures quick and error-free processes, improving passenger satisfaction.
Advanced Use Cases
Blue-Green Deployments
A SaaS platform implements Blue-Green Deployment to roll out new features while minimizing downtime and risks.
- How Synthetic Monitoring Helps:
- Simulates user journeys in both Blue and Green environments to validate performance before switching traffic.
- Ensures workflows, like login and checkout, remain unaffected during deployment.
- Identifies and resolves issues in the new environment without disrupting live users.
- Example: An e-commerce platform uses Synthetic Browser Journey Monitoring to simulate the checkout process in a new (Green) environment. It confirms that payment workflows are functioning correctly before directing user traffic to the updated system.
Version Upgrades in Browser Applications
A travel booking app rolls out a new version with improved UI/UX and additional features.
- How Synthetic Monitoring Helps:
- Simulates key workflows like flight searches and ticket purchases in the upgraded version.
- Compares performance metrics (e.g., response times) between old and new versions.
- Ensures new features don’t introduce errors or degrade existing workflows.
- Example: A travel app tests its new version by simulating journeys in both old and upgraded versions. Monitoring identifies slow-loading pages in the new version, allowing the team to fix them before full rollout.
Canary Releases for Feature Validation
A FinTech platform tests new features like real-time fund transfers using a subset of users.
- How Synthetic Monitoring Helps:
- Simulates workflows in the canary environment to validate new features.
- Continuously monitors for performance regressions or errors.
- Ensures smooth integration of new features into the main system.
- Example: A FinTech app introduces instant fund transfers to selected users. Synthetic monitoring validates the feature's performance and detects errors, allowing fixes before a full release.
