


Anomalies are troublesome and seem to have a mind of their own! They sneak up on your system and cause problems, leaving you frantically trying to figure out why you have suddenly got a customer with money deducted from their account, and a cafe reporting that they have not received a payment. Or, there has been a sudden surge in activity across your transaction servers, due to increased cyber attacks and not actual customers trying to make payments. A proper miscreant, and the worst part is: it usually has no obvious characteristics to identify it.
Anomaly detection methods are now an integral part of many companies dealing with a large customer base, and can help expose undetected problems in systems by automatically identifying strange values, like long delays in receiving an OTP for a payment transaction. By automatically detecting such anomalies and flagging it, companies can quickly take corrective measures and avoid loss of customers and revenue! Most importantly, if you are experiencing problems in your system but have a lot of different components to it, anomaly detection methods can help reduce the search space by automatically pointing out which of your system’s metrics is not functioning correctly. This considerably increases the company’s overall efficiency.
But what exactly is an anomaly?
Intuitively, you are likely to have an idea of what an anomaly is. An example can be a customer suddenly making 10 payment transactions in a day when his/her average is only once per month. It is challenging to come up with a specific set of rules to delineate what is an anomaly and what is not, across different situations. This makes it difficult to systematically look for anomalies, since we do not have a rulebook to specify what we are looking for. But before diving into the actual algorithms used for anomaly detection, let us look at two common misconceptions.
Misconception 1: Anomaly thresholds are easy to design.
How much is too much? How much is too little? These questions will give you a better idea into what thresholds can look like. When you have data where all the data points create a range of values, there are certain threshold values that delineate what could be strange values for that particular data. The idea is that any datapoint that crosses this threshold would then be considered an anomaly. Take some time series data for example, if you had only one time series data to worry about, you could possibly design this threshold yourself. But in real life situations, enterprise operations have hundreds of different time series to monitor, and manually analysing all these different time series data becomes almost impossible.
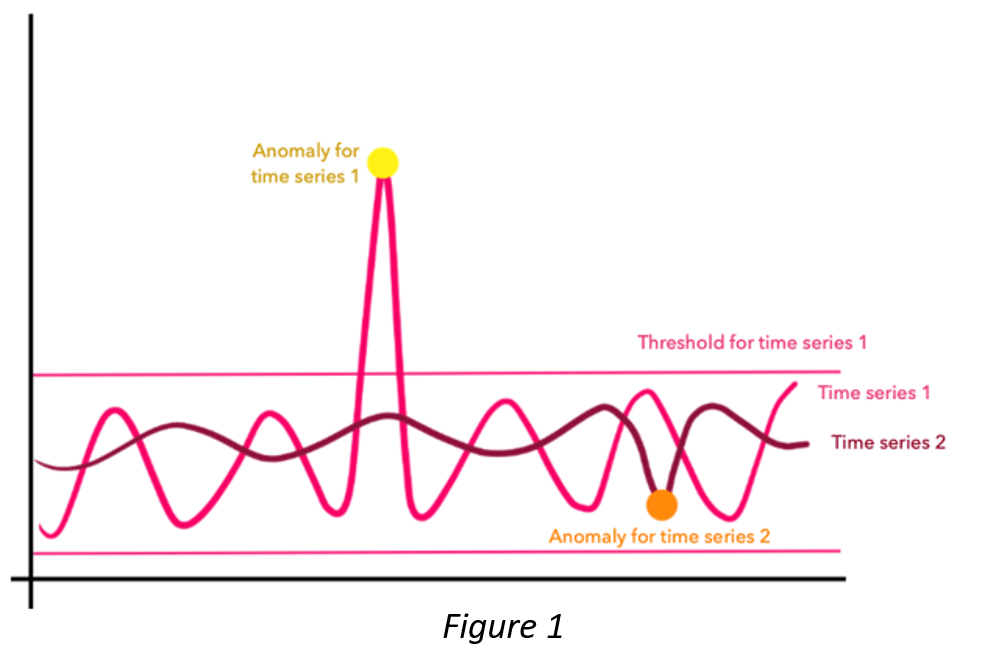
Misconception 2: Anomalies are always going to be outside threshold limits.
Now, let us say you deploy some intelligent algorithm to gauge what your overall anomaly thresholds should be. Job completed, right? If only it was that simple. While having thresholds can be very helpful in catching some anomalies, there are many instances in which the anomaly is within the threshold limits. How can this be possible?
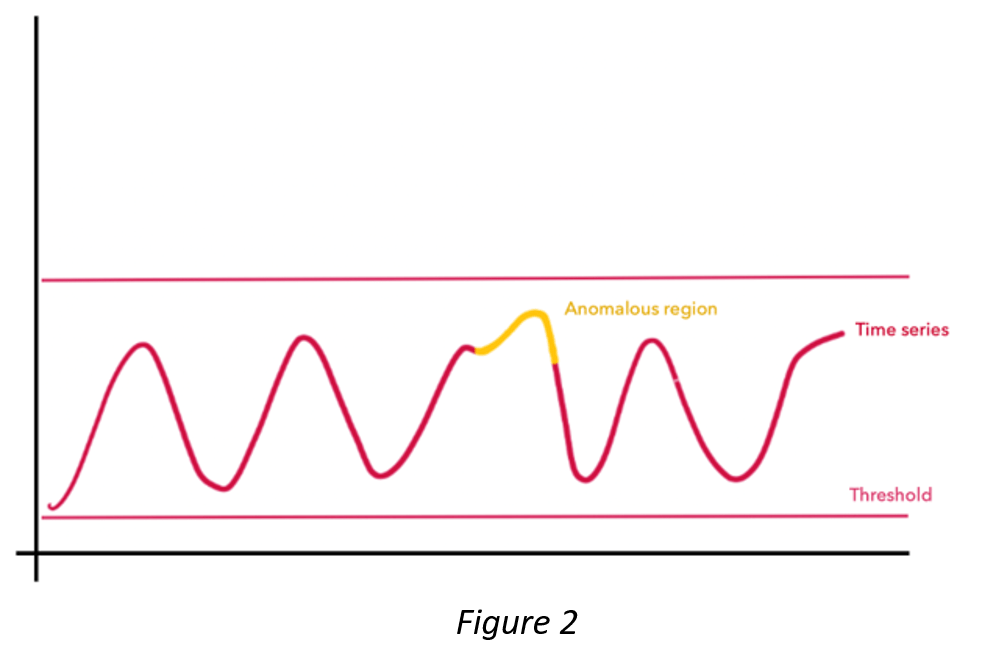
Take a look at Figure 2, which shows you the amount of internet traffic in a certain area over time. The traffic usually increases during the daytime, and drops at night, as you can see in the graph. But what if one day Amazon announces a new sales festival starting at 3:00AM, after many months of no offers? Practically everyone on the net will be buzzing about it, leading to lots of digital payment transactions at night, causing a sudden increase, like the yellow point in Figure 2. This is an anomaly, but you can see that it does not cross any of the thresholds.
As we now understand, properly defining and detecting anomalies is difficult, primarily because accurately extracting and defining every kind of normal behaviour is a really difficult task. And if defining a normal behaviour in your data is not challenging enough, there are times when the whole concept of what is normal changes continuously, and you have to keep up with it! Such concept drifts add to the complexity of the problem. Furthermore, the elusive anomaly is also conceptualised differently, depending on the context and domain; an anomaly in your body temperature and an anomaly in the stock market prices are not going to look the same.

This is where Machine Learning and
Artificial Intelligence come into play.
The Machine Learning and Artificial Intelligence algorithms can unravel patterns and rules which are almost impossible for the human mind to identify, and go beyond the notion of using simple thresholds. Machine Learning algorithms can be broadly classified into four categories : Supervised, Unsupervised, Semi-Supervised and Reinforcement, and the first three categories are often used in developing anomaly detection algorithms.
When you have data wherein each occurrence has a label, you call that a supervised learning problem. For example, every occurrence of a payment has a label of classifying it as being an anomaly or not. In this case, your algorithm would try to find the underlying patterns and rules governing the ones that are already labelled, and then using these findings, assign the appropriate label to new data (which does not have any labels). When it comes to anomaly detection, there is data that labels anomalies like this, which makes it possible to use supervised learning algorithms. However, such data is very limited and often very noisy. So, we also have to turn to unsupervised learning algorithms, where the objective is to find dynamic thresholds and data clusters, without using any data labels. One can also combine these two methods, making it a semi-supervised learning algorithm.
This is the approach that VuNet has also taken; we combine supervised and unsupervised learning algorithms to provide state-of-the art anomaly detection techniques integrated into our AI-driven enterprise monitoring platform. Since there is no single technique that works in all situations, we use an ensemble of methods, which intelligently combines advanced Machine Learning techniques with simple statistical models. This enhances both the speed and efficiency of anomaly detection. VuNet’s AI algorithms not only detect anomalies with high accuracy, but also automatically tune the algorithm parameters, thereby reducing the dependency on human intervention.
Now, while AI driven anomaly detection algorithms can definitely do a lot, there are also things that they cannot do. It is important to understand that anomaly detection systems cannot actually prove that there is an anomaly in the system, it can only point out that there is something unusual about the metric you are observing. More importantly, it cannot replace human judgment and experience, which is very important to remember! Finally, while it can see that there is something unusual, it cannot carry out an entire root cause analysis (RCA) on the problem. Though it is definitely an important component in the process, RCA is an endeavour on its own. At VuNet we believe it is important to have an integrated view on anomalies rather than an isolated one. Contextualising anomalies with parameters like user experience or the organisation’s KPIs help us investigate anomalies as a component of RCA, making the exploration more meaningful. We will learn more about RCA later in this blog series!
So, this blog has taken you through some basics of anomaly detection, and highlighted the main problems that exist in this field.
Then the question remains, what are the ways in which one can build a good anomaly detection system? There are many different methods to approach this, and we will discuss them in the next blog. Even better, in our next blog of this blog series, we will give you a little peek into the kind of anomaly detection methods we use at VuNet!
VuNet Systems is a deep tech AIOPs startup revolutionizing digital transactions. VuNet’s platform vuSmartMaps™, is a next generation full stack deep observability product built using big data and ML models in innovative ways for monitoring and analytics of business journeys to provide superior customer experience. Monitoring more than 3 billion transactions per month, VuNet’s platform is improving digital payment experience and accelerating digital transformation initiatives across BFSI, FinTechs, Payment Gateways and other verticals.


